Soil testing is a helpful tool for monitoring soil fertility and determining lime and fertilizer requirements for crops, including row, forage, and horticultural crops. Soil tests measure the pool of available plant nutrients in the soil, and the soil test report provides the results and recommendations for improving crop yields. Understanding a soil test report is essential so crop productivity is enhanced, and nutrient (and monetary) resources are not wasted. This publication provides a brief overview of interpreting routine soil test laboratory reports.
Overview

Figure 1. Example of soil test results from the Clemson University Agricultural Service Laboratory (ASL). Image credit: screenshot by author.
An accurate soil report starts with collecting representative soil samples. Refer to the Land-Grant Press publication “Precision Agriculture-Based Soil Sampling Strategies” to identify the best soil sampling method for your needs. For this publication, we are utilizing a soil test report from Clemson University’s Agricultural Service Laboratory (ASL) as an example of the most common information provided on soil reports. Standard soil test options include pH, buffer pH, phosphorus, potassium, calcium, magnesium, zinc, manganese, boron, copper, sodium, cation exchange capacity (CEC), and base saturation (figure 1). Beyond the actual values of nutrients, the report provides fertilizer and lime recommendations for various crops based on the nutrient availability in the given soil sample.
Introductory Section in the Report
Each report includes who requested the report and information about submitted samples, such as sample ID number and soil code assigned by the client. The lab number, customer account number, and client ID are also noted. Most laboratories have detailed instructions on collecting a soil sample, the types of analyses performed, and how to fill out the soil test request form. For example, the ASL has instructions for requesting soil tests in the guide, “How to Complete a Soil Form for Sample Submission to the Agricultural Service Laboratory.” Most labs require crop codes on the request form, and a list of codes is provided on the ASL website. A crop code represents the crop to be grown in that field and the expected yield for which fertilizer recommendations are needed. For example, the ASL crop code C90 indicates that the crop is corn, and the expected yield is 90 bu/ac.
Soil codes are also required on the request form. Soil codes differentiate soil types based on inherent characteristics (such as textures, mineralogy, and landscape position) and because of their different management history. Dividing soils into types (codes) allows for more precise fertilizer and liming recommendations. South Carolina soils are divided into six different soil codes, which are listed on the ASL website. If unsure of the soil type, consult the lab or an Extension Agent for assistance. Contact information for Extension staff at South Carolina county offices is available on the Cooperative Extension website.
Soil Analysis Section
The soil analysis section includes pH, buffer pH, and plant nutrient reserves of phosphorus, potassium, calcium, magnesium, zinc, manganese, boron, copper, and sodium, cation exchange capacity, lime requirement, and percent base saturation. Different laboratories may present these results in various units and may include visual aids related to nutrient reserves. For example, reports from the ASL give nutrient reserves in pounds per acre (lbs/ac), while the North Carolina Department of Agriculture and Consumer Services Agronomic Services Division reports nutrient reserves as an elemental soil test index and provide corresponding fertilizer recommendations in lbs/ac. The soil test index can be converted to ppm (mg/L or mg/kg) or lbs/ac using multiplication factors given on the website, ncagr.gov/agronomi/obt14.htm. The ASL visually shows nutrient reserves on a scale of ‘Low,’ ‘Medium,’ ‘Sufficient,’ ‘High,’ and ‘Excessive’ ranges based on the crop to be grown.
- Low: the nutrient is deficient for crop production. Applying nutrients to the soil in the low range has a higher chance of increasing crop yield.
- Medium: the nutrient is present in adequate amounts for moderate yields.
- Sufficient: the nutrient is available in an adequate amount for consistent high crop yield.
- High: the nutrient is available at levels that can adversely affect crop yield, and further application can decrease the crop yield and lead to imbalances in plant nutrient uptake.
- Excessive: the nutrient is available at levels that can adversely affect plant yield, create nutrient imbalances, and lead to other nutrient deficiencies.
pH
Soil pH, also known as soil reaction, is a measure of soil acidity or alkalinity. Optimal soil pH levels for most crops are between 5.8 and 6.5.1 Adding lime to the soil increases alkalinity and, subsequently, the pH level. Soil pH less than 6 will decrease the availability of phosphorus, potassium, sulfur, calcium, magnesium, and molybdenum, while soil pH greater than 7 will decrease the availability of iron, manganese, copper, and zinc (figure 2).
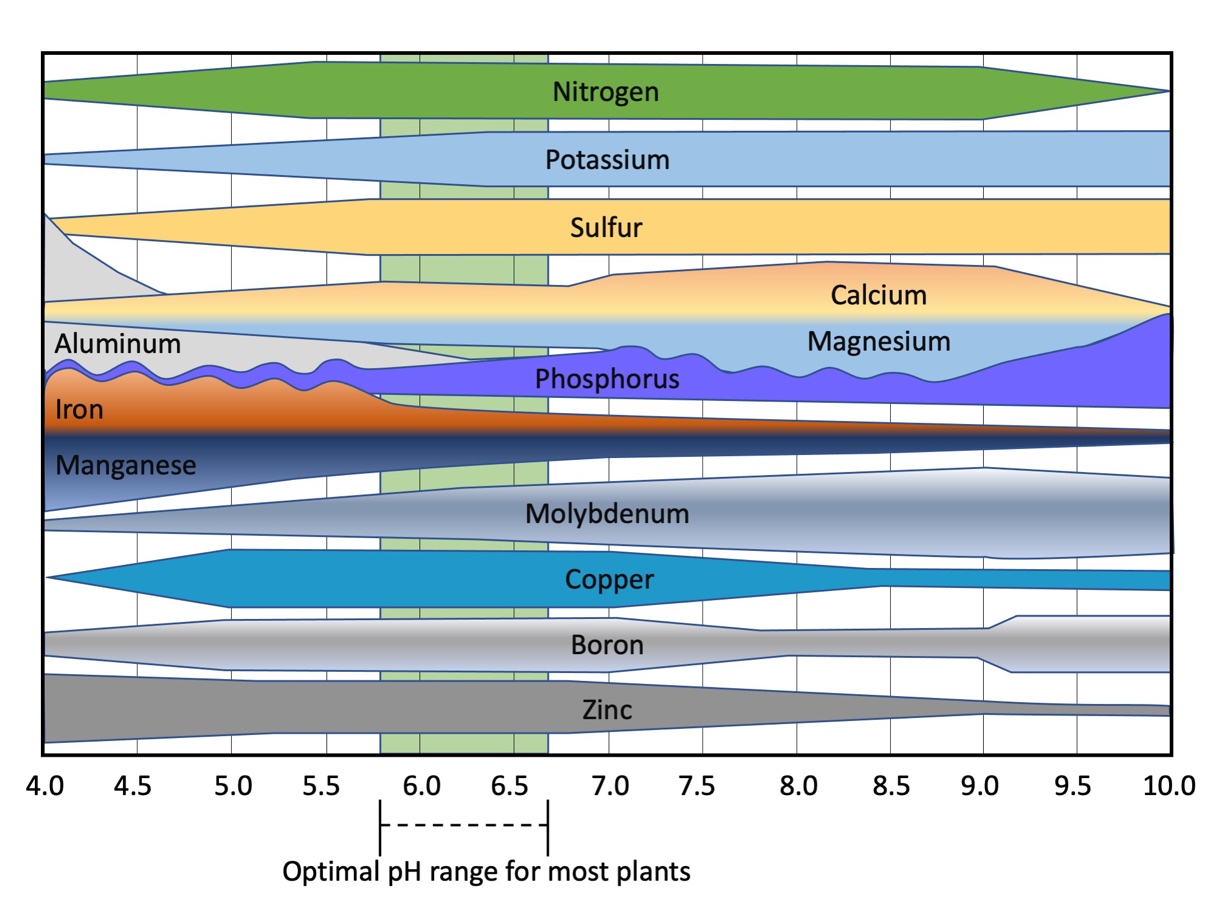
Figure 2. Availability of nutrients to plants over a pH range from 4–10. Thicker bars = most available and thinner bars = least available. Image credit: Sarah White, Clemson University.
Buffering Capacity
In ASL soil test reports, buffer pH refers to the residual or reserve soil acidity, which along with soil pH and cation exchange capacity (CEC), determine the buffering capacity of a soil. Laboratories also refer to buffering capacity as ‘pHc.’ The soil buffering capacity helps to estimate the amount of lime needed to increase the soil pH to the desired level. Soils with higher clay, organic matter content, and cation exchange capacity have higher buffering capacity. It is important to mention here that not all clays are the same. Most clay in South Carolina and the southeastern United States have relatively low CEC (< 10 meq/100 g of soil). The greater the difference between the pH and buffer pH values, the less buffering capacity the soil has. Adversely, soil with higher buffering capacity translates into higher rates of lime (or other amendments) required to increase soil pH to the desired level. 2,3
Macronutrients
Phosphorus and Potassium
Phosphorus (P) and potassium (K) are crucial macronutrients for optimum plant growth. Soil with 41–54 lbs/ac of P is sufficient for plant growth on sandy loams, silt loams, and clay loam soils (table 1). However, 61–80 lbs/ac is the sufficient range of P on coarse-textured soils when depth to the clay layer is 20–40 in. Soil with 157–182 lbs/ac K is sufficient for plant growth on most soils, but when the level of K is < 71 lbs/ac, a crop yield can decrease.
Table 1. Soil test rating used in South Carolina based on the available soil test phosphorus (P), potassium (K), calcium (Ca), and magnesium (Mg) levels (lbs/ac).
| Soil Test Rating | Phosphorus For coarse-textured soil with depth to clay layer between 20-40 inches |
Phosphorus For sandy loams, silt loam, and clay loam soils |
Potassium | Calcium | Magnesium |
|---|---|---|---|---|---|
| Low | <31 | <21 | <71 | <401 | <33 |
| Medium | 31-60 | 21-40 | 71-156 | 401-800 | 33-60 |
| Sufficient | 61-80 | 41-54 | 157-182 | 801-1600 | >60 |
| High | 81-120 | 55-80 | 183-235 | 1601-2000 | |
| Excessive | >120 | >80 | >235 | >2000 |
Source: Clemson University Agricultural Service Laboratory.
Calcium and Magnesium
Calcium and magnesium are important exchangeable cations that help to promote good soil structure, thereby improving venting, water infiltration, and water holding capacity. Subsequently, these cations provide a more favorable environment for the growth of plant roots and soil microorganisms.4 Both are also macronutrients required by plants. The sufficient range of Ca2+ and Mg2+ are 801–1600 and >60 lbs/ac, respectively (table 1). The presence of a higher concentration of Ca2+ in the soil indicates a greater amount of clay. Plants exhibit Ca2+ and Mg2+ deficiencies when soil pH is less than 6 (figure 2).5 If no lime is recommended in the report, Ca2+ and Mg2+ deficiencies can be corrected by adding gypsum (CaSO4.H2O) and Epsom salt (MgSO4.7H2O), respectively.6
Sulfur
Sulfur is usually not part of the standard package of soil tests, but a request can be made to determine it. Organic matter is a significant source of sulfur in the soil, but due to the low organic matter of most South Carolina soils (< 1%), a supplemental application of sulfur is often needed to meet the crop demand. The ASL recommends 10 lbs/acre of sulfur for field crops grown on soil types 1 and 2 in South Carolina. Sulfur can be supplied by applying ammonium sulfate, sulfur-coated urea, potassium magnesium sulfate, or other sulfur-containing fertilizers (i.e., 24-0-0-3% S solution or more popularly known as 25-S).
Micronutrients
Crops require relatively small quantities of micronutrients (iron, manganese, zinc, boron, and copper) compared to crop demands for macronutrients. The availability of micronutrients in soils is dependent on soil pH. Micronutrients usually become deficient when soil pH is more than 6.5 (figure 2). The coastal plain soils of South Carolina generally have a soil pH of less than 6.5; therefore, micronutrient deficiency rarely occurs. Micronutrient deficiency symptoms for crops such as peanut, oat, wheat, and cotton are displayed when soil pH is > 6.6, while soybean displays symptoms at pH levels between 6.2–6.5. Zinc is commonly recommended only for corn when grown on deep sandy soils. Soil zinc levels can be raised by broadcasting zinc sulfate or other zinc sources. A foliar application of zinc is recommended for the tree crops like peach and apple when a deficiency is confirmed based on leaf analysis. The boron level in soil is categorized as ‘insufficient’ or ‘low’ when extractable boron is less than 0.1 lbs/ac. In such cases, a boron application is recommended for South Carolina soils to satisfy crop demand. Manganese toxicity occurs when soil pH is < 5.2 and manganese content is above 400 lbs/ac. Manganese content < 80 lbs/ac is considered low.6
Soluble Salts (Electrical Conductivity, EC)
Soil electrical conductivity is a measure of the salinity or salt content in the soil. Electrical conductivity of more than 4 dS m-1 can potentially damage certain crops. Higher EC can hinder plant growth by affecting soil-water balance, which affects nutrient uptake and causes a nutrient imbalance.6 In particular, soils with a higher sodium concentration can exhibit additional problems such as poor soil structure, resulting in poor infiltration and drainage and toxicity for many crops. Typical salt-tolerant crops (capable of growth in soil with EC 3.2-8.0 dS m-1) grown in South Carolina include barley, cotton, sugar beet, wheat, soybean, and peanut.7, 8
Nitrogen
Soils contain nitrogen in the form of ammonium and nitrate. The ammonium form is converted to nitrate under aerated and moist field conditions. The nitrate form is very mobile in the soil; thus, heavy rainfall or irrigation can quickly transport the nitrate to a lower soil horizon. Therefore, most states recommend soil sampling up to 4 ft to account for residual nitrate. In South Carolina, nitrogen recommendations are based on yield goals and the type of crop grown. However, producers should use field history to provide nitrogen credit based on crop rotation with legume crops such as soybean, peanut, and cover crops or the use of animal manure. Field data from the southeastern United States shows that there is high inter-annual variability in soil nitrogen, and additionally, most soils have less than 1% organic matter. Therefore, soil tests for nitrogen are generally not conducted or recommended. However, a request can be made to determine soil nitrate content. When applying nitrogen fertilizers, split applications are recommended rather than one single application. Nitrogen fertilizer application for legume crops such as soybean and peanut is not recommended, as these crops can symbiotically fix N from the atmosphere, and thus, adding N fertilizer is not economical.
Organic Matter
Soil organic matter is an organic portion of soil derived from plant or animal tissues in various stages of breakdown (decomposition). Organic matter is an important indicator of soil health as it contributes to soil productivity in many different ways. South Carolina soils are highly weathered and, as mentioned above, rarely have organic matter greater than 1%. Therefore, fertilizer applications are needed to meet crop nutrient demands. The organic matter content is not a standard soil test, and it does not change quickly. However, if growers apply organic inputs or include high biomass-producing cover crops into their rotations, adjustments can be made to the input recommendations from soil test results. In such cases, organic matter should be monitored once every few years.
Cation Exchange Capacity (CEC)
Cation exchange capacity is used to determine the number of positively charged ions that the soil can hold. Cation exchange capacity is a useful soil health indicator that shows the soil’s ability to supply essential nutrients for plant growth. Consider CEC as the ‘bank’ for elements and nutrients, where they are not accessible by plants until they migrate into the soil solution. In comparison, when in soil solution, these elements and nutrients are like money in a pocket and readily available to plants to be utilized. If not used, the nutrients can quickly be lost with percolating water. The cation exchange capacity is usually reported as milliequivalents per 100 grams of soil or cmol/kg. When CEC increases, the soil’s ability to hold more cations, such as calcium, magnesium, potassium, sodium, ammonium, copper, iron, aluminum, hydrogen, and manganese, increases.9 Soils with higher organic matter and clay content have a higher CEC than soils with higher sand content.10
Base Saturation
Base saturation of the soil indicates the percent of cation exchange sites filled with basic cations (Ca2+, Mg2+, K+, and Na+).11 Therefore, the soils with higher base saturation are generally more fertile. When the base saturation increases, the pH also increases. Soil pH decreases when acidic cations (H+ and Al3+) increase in the soil. The sum of acidic ions is reported as acidity, typically in the same units as CEC.
Fertility and Liming Recommendations
Fertilizer recommendations are based on crop-specific field research completed in the region. For example, research conducted in the southern region of the United States, where soils are similar to those found in South Carolina, is used for ASL recommendations and is available on the website. A lime recommendation will also be provided based on the soil code, pH and buffer pH values, and the selected crops. Economics plays a critical factor in the selection of a lime source to neutralize soil pH.2 These recommendations should be used as a reference point and modified according to production needs and circumstances.
Additional Resources
Soil Test Rating System: Clemson University Agricultural Service Laboratory (ASL)
Soil Fertility Recommendations: Clemson University Agricultural Service Laboratory (ASL)
Smith WB. Depth Control for Sweatless Soil Sampler. Clemson (SC): Clemson Cooperative Extension, Land-Grant Press by Clemson Extension; 2019 Jul. LGP 1004.
References Cited
- Jordan E, Park D. Identification, management challenges, and strategies when using coastal organic rich subsoil for landscape topsoil. Clemson (SC): Clemson Cooperative Extension, Land-Grant Press by Clemson Extension; 2020 Sep. LGP 1091. https://lgpress.clemson.edu/publication/identification-management-challenges-and-strategies-when-using-coastal-organic-rich-subsoil-for-landscape-topsoil/.
- Farmaha BS. Basis of Selecting a lime material. Clemson (SC): Clemson Cooperative Extension, Land-Grant Press by Clemson Extension; 2019 Oct. LGP 1023. http://lgpress.clemson.edu/publication/basis-of-selecting-a-lime-material/.
- Spies C, Harms C. Soil acidity and liming of Indiana soils. West Lafayette (IN): Purdue University, Cooperative Extension Service. 1988. AY-267.
- Rehm G. Calcium and magnesium: the secondary cousins. Minneapolis, (MN): University of Minnesota; 2008. p. 1–7.
- Gransee A, Führs H. Magnesium mobility in soils as a challenge for soil and plant analysis, magnesium fertilization and root uptake under adverse growth conditions. Plant and Soil. 2013 Jul;368(1):5–21.
- Plant nutrient element management of agricultural soils in South Carolina: based on soil test results. Clemson (SC): Clemson University, Agricultural Service Laboratory; 2007 [accessed 2021 April 1]. https://www.clemson.edu/public/regulatory/ag-srvc-lab/soil-testing/pdf/introduction.pdf.
- Smith JL, Doran JW. Measurement and use of pH and electrical conductivity for soil quality analysis. Methods for Assessing Soil Quality. 1997 Jan;49:169–185.
- Grieve, CM, Grattan SR, Maas EV. Plant salt tolerance. In: Wallender WW, Tanji KK, editors. Agricultural salinity assessment and management. 2nd ed. Reston (VA): American Society of Civil Engineers (ASCE); 2012. p. 405–459.
- Mukhopadhyay S, Masto R, Tripathi R, Srivastava N. Application of soil quality indicators for the phytorestoration of mine spoil dumps. In: Pandey VC, Bauddh K, editors. Phytomanagement of polluted sites. 1st ed. Amsterdam (NL): Elsevier; 2019. p. 361–388.
- Ramos FT, Dores EFdC, Weber OLdS, Beber DC, Campelo Jr JH, Maia JCdS. Soil organic matter doubles the cation exchange capacity of tropical soil under no-till farming in Brazil. Journal of the Science of Food and Agriculture. 2018 Jul;98(9):3595–3602.
- Chesworth W. Encyclopedia of soil science. AA Dordrecht (NL): Springer; 2007.