South Carolina has many water resources that provide opportunities for water-based recreational activities including swimming, boating, and fishing. Participation in these activities produces significant economic benefits and supports many jobs throughout the state. However, at times, water quality may be unsafe for immersion or skin contact due to high levels of pollutants such as bacteria or cyanotoxins. This article assists water management professionals, people interested in water recreation, and the public in understanding potential concerns and methods for determining if current conditions in a waterbody are likely to be safe for primary or secondary recreation.
Introduction
Clean water is fundamental for safety during water-dependent activities. The physical, chemical, and biological conditions of water have significant implications for both human health and the environment, potentially putting individuals at risk and harming aquatic ecosystems. To protect health and maximize enjoyment, individuals should consider the nature of recreational activities, the potential for pollutants, the impact of weather conditions on water quality, and the availability of water quality data. By evaluating these key points, individuals can make informed choices about where and when to enjoy water-based recreation activities.
Types of Water Recreation
In South Carolina (SC), primary-contact recreation includes complete immersion activities such as swimming, water skiing, snorkeling, and surfing. Secondary-contact recreation applies to less immersive activities like boating (figure 1), fishing, and wading (Figure 1; Regulation 61-68, 2023).
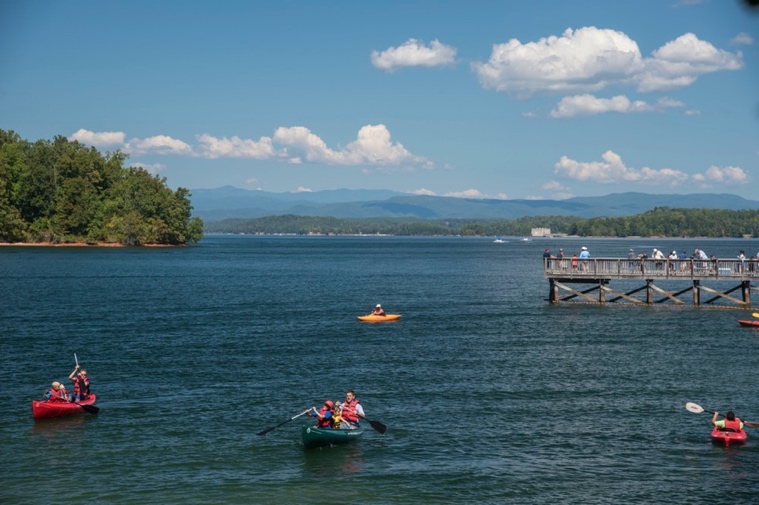
Figure 1. People Kayaking on Lake Keowee, SC. Note: Image credit: SC Wildlife Magazine.
Fishing is a popular sport that is important to SC’s economy; in 2011, South Carolinians and visitors spent approximately $686 million on fishing-related activities in the state (Willis & Straka, 2018). Many anglers enjoy catch-and-release fishing, but others consume the fish, which can introduce additional safety concerns. While a full discussion is beyond the scope of this article, the South Carolina Department of Environmental Services (SCDES) SC Fish Consumption Advisories website (https://bit.ly/SC_FishConsumptionMap) offers further guidance. The SCDES was created July 1, 2024 and incorporates many operations previously performed by the South Carolina Department of Health and Environmental Control (SCDHEC; Fish Consumption Advisories).
Water Quality Parameters
SCDES regulates state-specific water quality standards encompassing a range of parameters. This article highlights those of most interest in relation to fish health and to human health from recreational contact (Table 1).
Table 1. South Carolina Water Quality Standards Relevant to Water-Based Recreation
| Parameters of Interest | Standards for Primary Recreation |
| E. coli | ≤ 126/100 mL average during a 30-day period and ≤10% of samples exceed 349/100 mL |
| Microcystins | ≤ 8 μg/L |
| Cylindrospermopsin | ≤ 15 μg/L |
| Turbidity (Except for Lakes ≥40 acres) | ≤ 50 NTUs |
| Turbidity (for Lakes ≥40 acres) | ≤ 25 NTUs |
Note. Adapted from SCDES Regulations and Standards (Regulation 61-68, 2023).
Bacteria
Escherichia coli (E. coli), a type of bacteria typically residing in the intestines of warm-blooded animals, is the main indicator used to assess fecal contamination in South Carolina’s freshwater. SCDES monitors E. coli to identify locations with high levels, which typically indicate the water may be unsafe for primary recreation exposure. Bacteria sources include sanitary sewer overflows, improperly functioning septic systems, improperly managed livestock manure and pet waste, and wildlife (U.S. EPA, 2021a).
Cyanotoxins
Microcystins and cylindrospermopsin are cyanotoxins commonly produced by cyanobacteria blooms; they can be harmful to people, pets, livestock, and wildlife (U.S. EPA, 2014). Common exposure routes include ingestion, skin contact, and inhalation (Nix et al., 2022). SCDES monitors the levels of select cyanotoxins in strategic waterbodies where public recreation is popular and provides information about elevated cyanotoxin levels on their Algal Bloom Monitoring website (https://bit.ly/SC_HarmfulBloom_Map; SC Department of Environmental Services, n.d.a). Cyanobacteria, which can produce cyanotoxins, are typically more common in nutrient-rich, warm, stagnant waterbodies (Nix et al., 2022).
Turbidity
Turbidity, which refers to water clarity and the presence of suspended particles, is an important water quality parameter that influences aquatic ecosystems by affecting light penetration, pollutant transport, and the overall health of aquatic organisms (U.S. EPA, 2021b). Soil particles absorb pollutants such as bacteria, nutrients, and chemicals; then, the particles travel with other sediment into waterways. Low turbidity levels are generally associated with cleaner water, but other pollutants can still be present in a waterbody. Typical causes of turbidity include stormwater runoff, bottom-feeding fish, soil erosion, and waste discharge (U.S. EPA, 2021b).
Water Quality Monitoring
Monitoring water quality is essential to understanding the conditions and safety of bodies of water. However, water quality sampling can require significant time and financial resources, and it is not feasible to continuously monitor all of South Carolina’s many rivers, lakes, and ponds. Additional challenges include obtaining and understanding water monitoring results, delays between taking a sample and receiving results, and rapidly changing conditions in surface waterbodies.
Water quality sampling can produce significant amounts of data available through a variety of organizations; the following paragraphs discuss common data sources specific to SC. Professional water quality testing typically produces accurate results. Some parameters, like pH and dissolved oxygen, can be tested directly in the field; others, such as bacteria levels, involve lab analysis that requires time. Hence, sampling results are typically not available for the exact moment in which an individual is engaging in water-based recreational activities. Additionally, water quality conditions can change quickly, as they are influenced by a variety of factors such as weather (e.g., rainfall), upstream water flows or discharges, and aquatic plant growth.
SCDES
SCDES conducts water quality monitoring throughout the state, and a list of sampling locations is available through the SC Watershed Atlas website (https://gis.dhec.sc.gov/watersheds/), which categorizes locations into historic sites, routine sampling sites (visited approximately once a month), and randomly rotated annual sample sites (SC Department of Environmental Services, n.d.b).
SCDES utilizes water quality monitoring results to determine compliance with water quality standards and to establish long-term trends in water quality (Figure 2; Regulation 61-68, 2023). When SCDES identifies locations that do not meet water quality standards, they may add them to the 303(d) “Impaired Waters” List (https://des.sc.gov/programs/bureau-water/south-carolina-303d-list-impaired-waters-tmdls) and develop a plan to improve the water quality (South Carolina 303(d) List of Impaired Waters & TMDLs, n.d.).
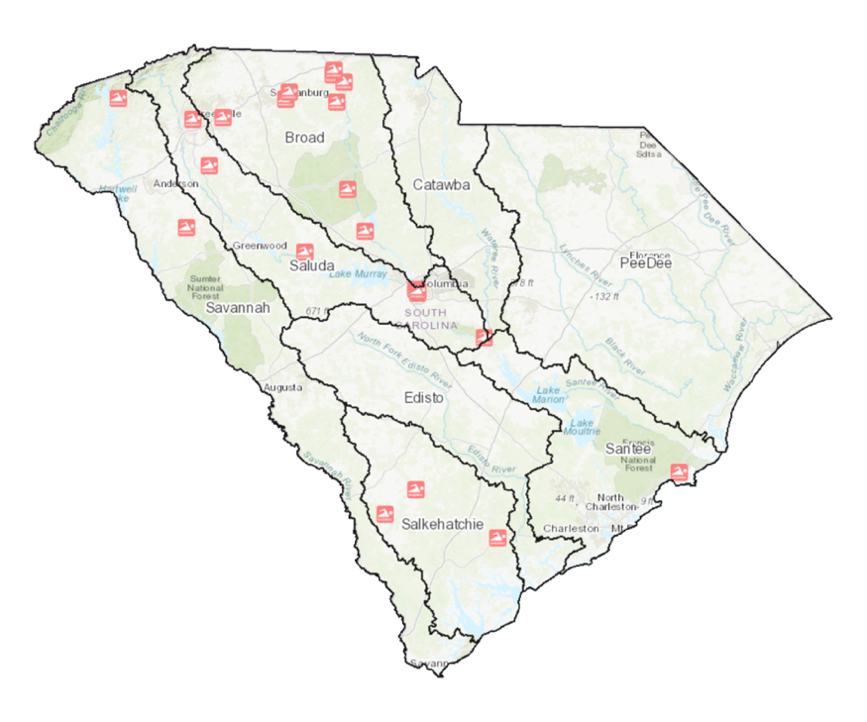
Figure 2. Swimming Advisories Layer in SCDES’s Watershed Atlas Note: This layer indicates waterbodies that are frequently unsafe for swimming based on long-term trends in sampling results. Image credit: Masha Bokar.
SC Water Monitoring Portal
The SC Sea Grant Consortium hosts the SC Water Monitoring Portal (https://www.scseagrant.org/sc-water-monitoring-portal/), an interactive map-based website that consolidates water quality sampling data from various sources and allows users to view and download data (SC Sea Grant Consortium, n.d.).
U.S. Water Quality Portal
The Water Quality Portal website (https://www.waterqualitydata.ushttps://www.waterqualitydata.us) is a partnership between the U.S. Geological Survey (USGS) and U.S. Environmental Protection Agency (USEPA). The portal compiles publicly available water quality data from numerous sources throughout the United States. The tool allows users to search for and download various data sets, and the user can leave search selections blank to return a larger data set (National Water Quality Monitoring Council, n.d.).
USGS Water Quality Data
The USGS Water Quality Data for South Carolina website (https://waterdata.usgs.gov/sc/nwis/qw) provides access to real-time data including water quality conditions such as pH, temperature, and dissolved oxygen. These measurements are collected by continuous monitoring equipment at select USGS gage sites and transmitted every minute to provide nearly real-time updates with minimal delay. This system offers valuable insights into water quality conditions that support environmental monitoring, resource management, public awareness, and research efforts (U.S. Geological Survey, n.d.).
SC Adopt-A-Stream
The SC Adopt-A-Stream Program trains volunteers to conduct limited monthly water quality testing and report the data on the publicly accessible SC Adopt-A-Stream Database website (https://scaas.app.clemson.edu/home.php; SC Adopt-A-Stream, n.d.).
How’s My SC River?
The Congaree Riverkeeper offers this easy-to-use tool to inform people of recent water quality conditions in various locations in the Midlands area of SC during select months. Visit the “How’s My SC River?” website (http://howsmyscriver.org/midlands/map) to learn more (Midlands River Coalition, n.d.).
Do-It-Yourself Tests
An individual interested in certain water quality conditions in a specific location can use a do-it-yourself test kit. There are many options available depending on the parameter of interest, including but not limited to lead, iron, chlorine, nitrate, nitrite, fluoride, and mercury. When considering do-it-yourself water quality testing options, keep in mind that tests may offer different detection levels and that the accuracy of the results depends on the user carefully following all instructions.
Visual Inspection
While water quality monitoring data is generally the basis of determining if long-term water quality trends are safe for recreation, current data is not available for all param
eters of concern or all waterbodies. When data is not available, visually inspecting a waterbody can provide clues that current conditions may be unsafe for immersive activities.
During and after rain, stormwater runoff picks up materials like oil, grease, fertilizer, and trash as it flows across land and often carries these pollutants into surface waterbodies such as streams, rivers, wetlands, and ponds. Some of these pollutants, like bacteria, can be harmful to human health and are largely invisible to the human eye. However, other pollution indicators, such as turbidity, may be easier to observe and can indicate that a water body is currently impacted by stormwater runoff, which often results in increased water quality concerns (U.S. EPA, 2021b). In the Upstate region of SC, it is not uncommon to see streams “run red” following a rain event (Figure 3); this color is caused by increased levels of sediment (typ
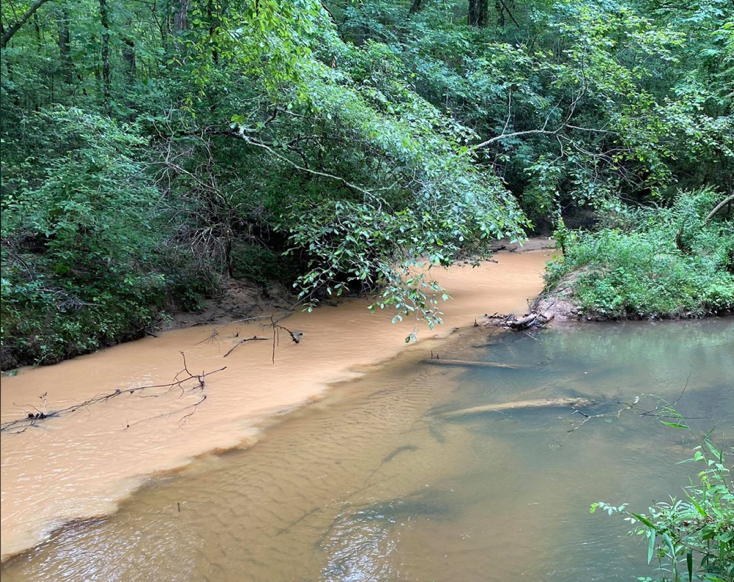
Figure 3. Stream with High Levels of Turbidity and Clear Water. Note: Image credit: Cahaba Riverkeeper
ically caused by soil erosion) and can be a simple visual indicator that water quality may be unsafe for swimming or other water-based recreation activities. High sediment levels often indicate upstream runoff or discharge, which can contain pollutants like bacteria, nutrients, and chemicals, either in the water or adsorbed to the sediment particles. Because these pollutants can pose health risks, it’s a good idea to avoid immersion and limit skin contact if a waterbody appears muddy (U.S. EPA, 2021b).
Known sources of potential pollutants are typically regulated through state and federal permits; however, unknown (and unpermitted) sources of pollutants also exist and can present challenges for regulatory control. Examples of unknown sources include deliberate dumping of oil or accidental release of gasoline from a vehicle accident. These releases may not be related to stormwater runoff and may present visual indicators that could be caused by human or natural causes.
- Oil sheen on surface (Figure 4) – can be natural or from oil or other petroleum-based substances. Use a stick to stir the area and break apart the sheen; if it shatters, it’s likely natural, but if it quickly reattaches, it is likely petroleum based and indicates that the water may be unsafe for recreation (Lenahan, 2019).
- Presence of foam or excessive bubbles (Figure 5) – can be natural or from an unpermitted discharge. Fast-moving water passing over rocks may naturally form white bubbles, commonly called “whitewater.” In calm, slow-moving water, naturally occurring bubbles are typically off white or brown and smell earthy, while white fresh-smelling bubbles are more likely the result of an illicit or non-natural source.
- Discolored water (Figure 6) – can occur for a variety of reasons ranging from dye testing to a cyanobacteria bloom or a chemical spill. If the cause is unknown, consider avoiding contact with the water.
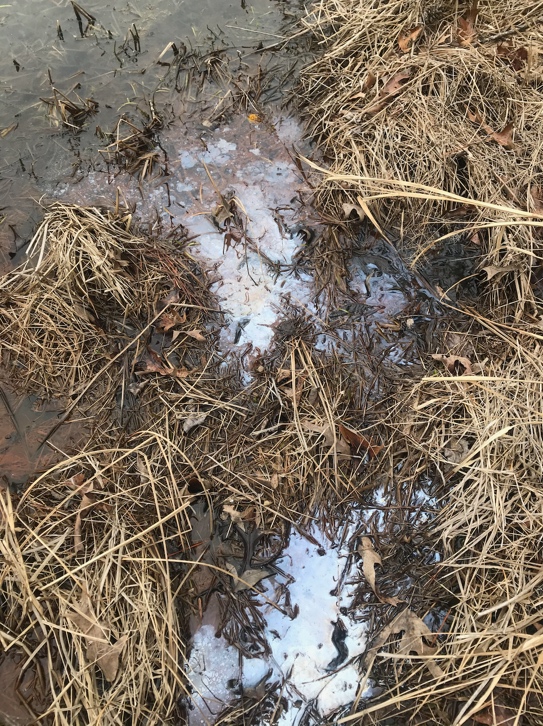
Figure 4. Natural Sheen Found on Pond Water. Note: Image credit: Heather Nix.

Figure 5. Pollution Bubbles on the Surface of a Stream. Image credit: Heather Nix
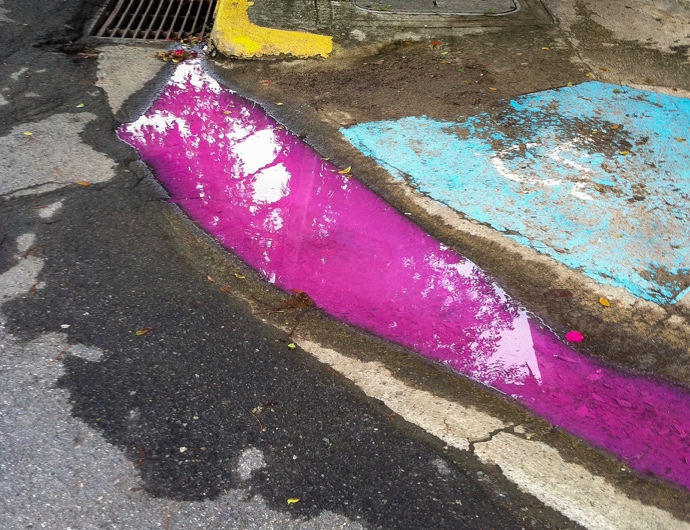
Figure 6. Pink Stormwater Alongside a Sidewalk. Note. Image credit: Dara Park.
Conclusion
In conclusion, water quality conditions significantly influence the safety of humans engaging in water-based recreational activities. Reviewing water analysis results and available information provides a better understanding of water quality trends in a specific waterbody. Visually inspecting waterbodies for signs of potentially unsafe conditions helps keep people safe while enjoying South Carolina’s water resources. In addition, individuals and communities can take actions to protect and improve water quality, helping ensure safer water for enjoyment and economic benefits.
References Cited
- Fish consumption advisories. (2020, March). SC Department of Environmental Services. https://gis.dhec.sc.gov/gisportal/apps/webappviewer/index.html?id=c71943bc743b4ca196e0ef0406b1d7ab.
- Lenahan, G. (2019, October 1). Oil Sheens – All That Glitters … Isn’t Necessarily Pollution. PA environment digest blog. https://paenvironmentdaily.blogspot.com/2019/10/dep-our-common-wealth-blog-oil-sheens.html
- Midlands River Coalition. (n.d.). How’s My SC River [interactive map]. Retrieved 21 September, 2023, from http://howsmyscriver.org/midlands/map.
- National Water Quality Monitoring Council. (n.d.). The water quality portal. Retrieved 21 September, 2023, from https://www.waterqualitydata.us.
- Nix, H. B., Sahoo, D., White, S. A., Hains, J., & Busari, I. (2022, October 31). Harmful algal blooms: Prevention, response, and avoidance manual. Clemson Extension. https://dc.statelibrary.sc.gov/server/api/core/bitstreams/0086fa2e-49e5-4794-b528-37df05366191/content.
- Regulation 61-68 Water Classifications and Standards. Columbia (South Carolina): SC Department of Environmental Services; 2023 May. https://des.sc.gov/sites/des/files/Library/Regulations/R.61-68.pdf.
- SC Adopt-A-Stream. (n.d.). Clemson University. Retrieved 21 September, 2023, from https://scaas.app.clemson.edu/home.php.
- SC Department of Environmental Services. (n.d.a). Harmful Algal Blooms. [interactive map]. Retrieved 21 Sep, 2023, from https://sc-dhec.maps.arcgis.com/apps/webappviewer/index.html?id=a34a994444df4234b4b3f87b55eeac54.
- SC Department of Environmental Services (n.d.b). SC watershed atlas. Retrieved 21 September, 2023, from https://gis.dhec.sc.gov/watersheds/.
- SC Sea Grant Consortium (n.d.). The South Carolina Water Monitoring Portal. Retrieved 21 September, 2023, from https://www.scseagrant.org/sc-water-monitoring-portal/.
- South Carolina 303(d) List of Impaired Waters & TMDLs. Columbia (SC). (n.d.). SC Department of Environmental Services. Retrieved 21 September, 2023, from https://des.sc.gov/programs/bureau-water/south-carolina-303d-list-impaired-waters-tmdls.
- U.S. Environmental Protection Agency. (2021a, July). Factsheet on water quality parameters: E. coli (Escherichia coli). https://www.epa.gov/system/files/documents/2021-07/parameter-factsheet_e.-coli.pdf.
- U.S. Environmental Protection Agency. (2021b, July). Factsheet on water quality parameters: Turbidity. https://www.epa.gov/system/files/documents/2021-07/parameter-factsheet_turbidity.pdf.
- U.S. Environmental Protection Agency. (2014, September). Cyanobacteria and cyanotoxins: Information for drinking water systems. https://www.epa.gov/sites/default/files/2014-08/documents/cyanobacteria_factsheet.pdf.
- U.S. Geological Survey (n.d.). USGS Water-Quality Data for South Carolina. Retrieved 21 September, 2023, from https://waterdata.usgs.gov/sc/nwis/qw.
- Willis, D. B., & Straka, T. J. (2016, December). The economic contribution of natural resources to South Carolina’s economy. Clemson Experiment Station & South Carolina Department of Natural Resources. https://www.dnr.sc.gov/economic/EconomicContributionsSC.pdf.
Additional Resources
Busari, I, Sahoo, D., Nix, H. B., Wallover, C. G., White, S. A., & Sawyer, C. B. (2022, June 6). Introduction to harmful algal blooms (HABs) in South Carolina freshwater systems. Land-Grant Press, article 1146. https://lgpress.clemson.edu/publication/introduction-to-harmful-algal-blooms-habs-in-south-carolina-freshwater-systems/
Morganello, K. C. (2020, July 15). Water management in the home landscape (HGIC 1884). Clemson Cooperative Extension Home & Garden Information Center. https://hgic.clemson.edu/factsheet/water-management-in-the-home-landscape/
Nix, H. B., Hains, J., Sahoo, D., & White, S. A. (2022, December 14). Do it yourself: Visual indicators, stick test, and jar test for cyanobacteria (HGIC 1899). Clemson Cooperative Extension Home & Garden Information Center. https://hgic.clemson.edu/factsheet/do-it-yourself-visual-indicators-stick-test-and-jar-test-for-cyanobacteria/
Scaroni, A. E., & Wallover, C. G. (2020, August 10). Watershed-based planning to protect and improve surface water quality. Land-Grant Press, article 1085. https://lgpress.clemson.edu/publication/watershed-based-planning-to-protect-and-improve-surface-water-quality/.
Wallover, C. G. (2022, April 14). Benefits of riparian buffers along waterways. Clemson Cooperative Extension Home & Garden Information Center. https://hgic.clemson.edu/benefits-of-riparian-buffers-along-waterways/