Access to plentiful, clean water is critical for life and economic activity. South Carolina has typically been considered a water “rich” state, and surface and ground freshwater supplies have supported rapid population and economic growth for many years. However, the state faces challenges, including significant population growth, rapid land-use change, and variability in weather patterns attributed to climate change that can threaten the availability of water resources for sustainable future use.1 The late 1990s through early 2000s brought about one of the worst droughts in South Carolina’s history, which had long-term impacts on agriculture and timber industries, municipal water supply, and waterway health.2 As a result of drought events, coupled with growing demand for water resources, SC water managers anticipate future state-wide water shortages,3 which can have lasting impacts on South Carolina’s economy and residents. This article describes the main water use sectors in the state and provides an overview of recent annual water withdrawals.
Understanding how water is used and how much water is withdrawn from various sources will help sustainably manage water supplies into the future. Water is commonly used in South Carolina for drinking water; irrigation of crops and golf courses; production of electricity; manufacturing, mining, recreation; and support of aquatic ecosystems. South Carolina regulates both surface and groundwater withdrawals greater than three million gallons (MG) in any month and requires annual reporting to the SC Department of Health and Environmental Control (SCDHEC).
For a complete overview of South Carolina’s water use regulations, please see the Land-Grant Press publication “Water Withdrawal Regulation in South Carolina.”
Water Use Sectors
The main sectors that use water or rely on water availability in South Carolina include
- Aquaculture: Water is used for raising organisms that live in the water, whether for food, sport, or conservation.
- Golf Courses: Water is used specifically to “maintain golf course turf, including tee boxes, fairways, putting greens, associated practice areas and periphery aesthetic landscaping.”4
- Irrigation (e.g., agriculture): According to SCDHEC, encompasses water “used for agricultural and landscaping purposes including turf farming and livestock management.”4 Agricultural water use is mainly used to support plant growth and can also include water use for pre-irrigation, frost protection, chemical application, weed control, field preparation, dust suppression, and leaching salts from the root zone.5
- Manufacturing or Industrial: This category includes self-supplying manufacturing facilities and industries that withdraw water directly from a water body to use in their facility. Water can be used for various needs, such as processing, cooling, dilution, in-plant conveyance, or cleaning, and may be consumed or discharged into a waterway.
- Mining: Water is used for the extraction of minerals and other mining operations, such as dust control on roads. In January 2021, SCDHEC listed permitted active mining operations for the following: clay/sand, granite, river sand, vermiculite, lime, shale, soil, gold, and sericite.6
- Other: Water used for any purpose not specifically identified in any other category.4
- Power Generation: Electricity generation nearly always requires water. Hydroelectric uses the potential and kinetic energy of stored and flowing water, and thermoelectric uses water mainly for steam generation and cooling purposes. Water may also be used in air emissions control equipment at power plants.
- Water Supply: Water is withdrawn by public or private suppliers for distribution to other water users.4 According to the US Environmental Protection Agency, “a public water system provides water for human consumption through pipes or other constructed conveyances to at least fourteen service connections or serves an average of at least twenty-five people for at least sixty days a year.” 7 Water suppliers provide water for indoor or outdoor use by residential (aka domestic), commercial, and industrial users.
- Residential Self-Supply: Over 20% of SC residents depend on individual groundwater wells for drinking and other household uses.8 While the water use of individual homes is minor, collectively, this sector could be responsible for significant groundwater withdrawals.
- Instream Flow: South Carolina’s waterways provide environmental flows, assimilative capacity for wastewater, and recreational opportunities, such as boating, water skiing, fishing, and swimming. Water-based recreational activities typically do not involve water withdrawals but rather depend on water availability in a river or lake. The 2016 Economic Contributions of Natural Resources report indicates that water-related recreation is directly responsible for more than 75,000 jobs and more than $6.9 billion in revenue for South Carolina.9
Water Withdrawal Volumes
SCDHEC compiles an annual Water Use Report utilizing data reported by surface and groundwater users that withdraw greater than 3 MG in any month. Water withdrawals below the 3 MG threshold are typically not included in the Water Use Reports. With the exception of hydropower generation and mining, water withdrawals over the 3 MG threshold are typically regulated, regardless of if any portion of the water is returned near the source (i.e., non-consumptive use) or if the water is removed from the source water permanently (i.e., consumptive use). Many water use sectors return a portion of the water withdrawn near the source. A forthcoming article in the Journal of South Carolina Water Resources, “An Introduction to Consumptive Use of Water in South Carolina,” provides more information regarding consumptive and non-consumptive use in South Carolina.
From 2017 to 2021, facilities reporting a water withdrawal to SCDHEC increased from 1,004 to 1,209, with agricultural irrigation facilities outnumbering all other major users combined (table 1).10 However, a much different picture emerges when assessing the total volume of water withdrawn (table 1 and figure 1). By far, hydropower’s reported “withdrawals” outpace all other uses.10 Because hydropower does not technically remove water from a river, it is commonly excluded to allow evaluation of physical water withdrawals. When hydropower is removed from the evaluation to consider only physical withdrawals (figure 2), thermoelectric power generation withdraws the largest volume of water.
Annual withdrawals are not reported for Residential Self Supply; estimates of the number of private drinking water wells and estimated total annual usage for South Carolina are provided in table 2.
Overall, water users in South Carolina withdraw significantly more surface water than groundwater (figure 3 and table 3).4 For example, in 2021, more than 99% of the 1,699,387 MG total combined withdrawal reported for thermoelectric was from surface water sources. While many water users may rely on a combination of surface and groundwater sources, the only water use categories that withdrew a larger volume of groundwater than surface water in 2021 were irrigation (for agriculture), residential self-supply, and other.8,10,14-16
Table 1. Number of water withdrawers and reported annual water withdrawals (MG) per water sector. All data from SCDHEC Annual Water Use Reports.
| 201711 | 201812 | 201913 | 20204 | 202110 | ||||||
| # Users | Withdrawal (MG) | # Users | Withdrawal (MG) | # Users | Withdrawal (MG) | # Users | Withdrawal (MG) | # Users | Withdrawal (MG) | |
| Aquaculture | 4 | 446 | 5 | 578 | 7 | 702 | 5 | 625 | 5 | 527 |
| Golf Course | 164 | 6,386 | 164 | 5,421 | 177 | 6,527 | 161 | 5,053 | 160 | 6,024 |
| Industrial | 90 | 112,657 | 86 | 112,016 | 94 | 100,988 | 85 | 100,394 | 87 | 149,689 |
| Irrigation (i.e., Agriculture) | 444 | 51,360 | 525 | 54,941 | 621 | 64,703 | 623 | 47,536 | 653 | 51,348 |
| Mining | 14 | 3,636 | 15 | 3,120 | 12 | 1,809 | 12 | 1,564 | 12 | 1,543 |
| Other | 3 | 23 | 2 | 18 | 2 | 20 | 1 | 20 | 1 | 23 |
| Power – Hydro | 36 | 15,028,583 | 36 | 23,119,449 | 36 | 22,735,683 | 36 | 34,577,777 | 36 | 20,898,347 |
| Power – Thermo, except nuclear | 15 | 199,483 | 15 | 225,260 | 16 | 227,072 | 15 | 229,746 | 14 | 196,369 |
| Power – Thermo, only nuclear | 4 | 1,529,765 | 4 | 1,490,559 | 4 | 1,552,021 | 4 | 1,506,557 | 4 | 1,503,019 |
| Water Supply | 230 | 229,491 | 236 | 233,198 | 246 | 254,878 | 235 | 240,562 | 237 | 255,309 |
| Total | 1,004 | 17,161,830 | 1,088 | 25,244,560 | 1,216 | 24,944,403 | 1,177 | 36,709,834 | 1,209 | 23,062,198 |
Table 2. Estimated Number of Residential Self-Supply (i.e., private residential drinking water wells) and total annual withdrawal volumes, including assumptions.
| Residential Self-Supply | 2017 | 2018 | 2019 | 2020 | 2021 |
|---|---|---|---|---|---|
| SC Population Estimate14 | 5,021,268 | 5,084,156 | 5,148,714 | 5,130,729 | 5,190,705 |
| Estimated Individuals Using Private Wells (~20% of population8) | 1,004,254 | 1,016,831 | 1,029,743 | 1,026,146 | 1,038,141 |
| Estimated # Residential Self-Supply Wells (assuming 2.51 persons/household15) | 400,101 | 405,112 | 410,256 | 408,823 | 413,602 |
| Estimated Total Annual Water Withdrawal (MG) Residential Self Supply (assuming 100 gallons/day usage per person16) | 36,655 | 37,114 | 37,586 | 37,454 | 37,892 |
Figure 1. Total annual volume of all surface and groundwater withdrawals reported or estimated by water use sector in SC, from 2017 through 2021.4,8,10-16
Figure 2. Total reported and estimated volume of combined surface and groundwater withdrawals by water use sector, excluding hydropower.4,8,10-16
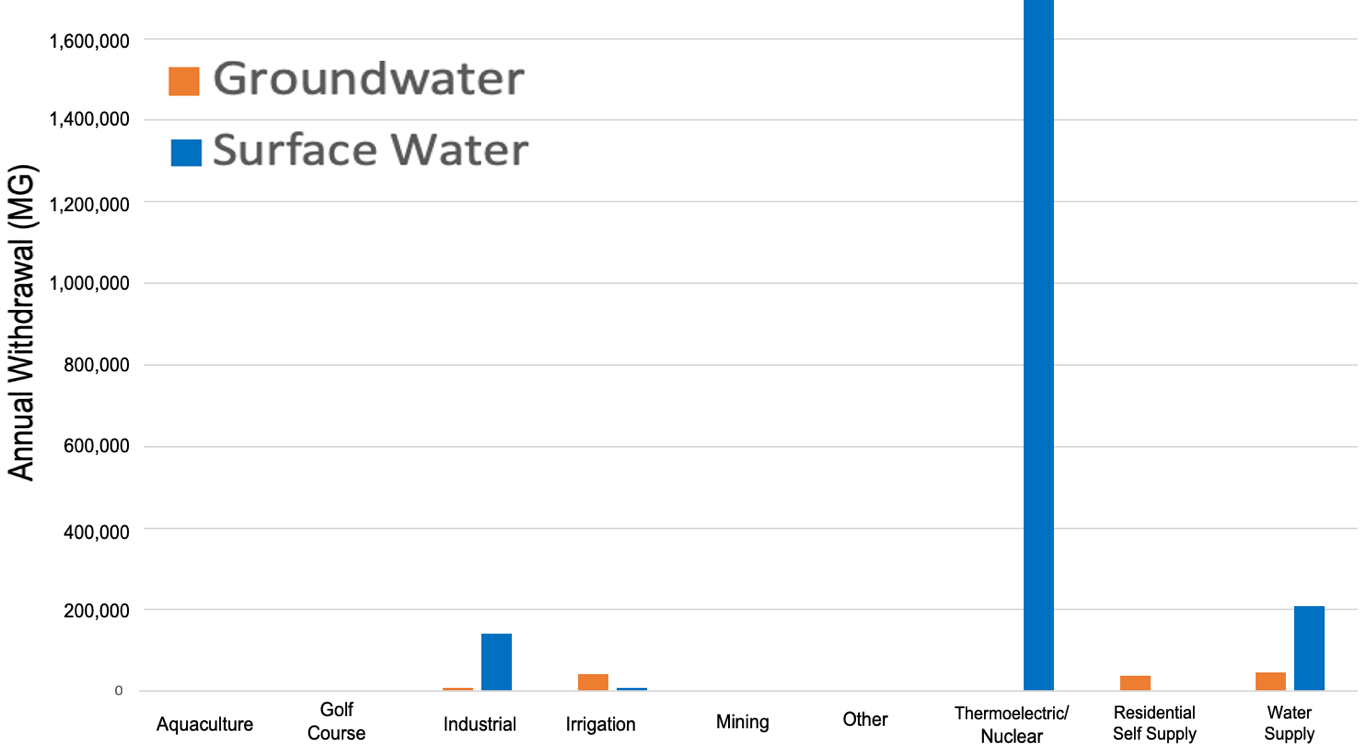
Figure 3. Total volume of surface and groundwater withdrawals by water use sector in SC for 2021, excluding hydropower.10
Table 3. Reported volume of water withdrawn from surface and groundwater sources for each water-use sector in 2021.10
| Water Use Sector | Surface Water (MG) |
Groundwater (MG) |
Total Withdrawal Volume (MG) | % Surface Water | % Groundwater |
|---|---|---|---|---|---|
| Aquaculture | 370 | 157 | 527 | 70% | 30% |
| Golf Course | 3,316 | 2,708 | 6,024 | 55% | 45% |
| Hydroelectric | 20,898,347 | – | 20,898,347 | 100% | 0% |
| Industrial | 140,509 | 9,180 | 149,689 | 94% | 6% |
| Irrigation, Agriculture | 9,005 | 42,342 | 51,348 | 18% | 82% |
| Mining | 1,094 | 449 | 1,542 | 71% | 29% |
| Other | – | 23 | 23 | 0% | 100% |
| Thermoelectric/Nuclear | 1,696,942 | 2,445 | 1,699,387 | >99% | <1% |
| Residential Self Supply | – | 37,892 | 37,892 | 0% | 100% |
| Water Supply | 209,668 | 45,642 | 255,309 | 82% | 18% |
| Total | 22,959,251 | 140,838 | 23,100,088 | 99% | 1% |
Conclusion
Understanding current water use and planning for future needs for water provision is critical for the well-being of South Carolinians. A basic understanding of water withdrawals is an essential first step toward sustainable water management. Most of the water withdrawn from South Carolina’s water supply is for energy production. Overall, water users throughout the state rely heavily on surface water sources. Additional evaluations should further consider the consumptive use of surface and groundwater withdrawals in South Carolina.
References Cited
- South Carolina State Water Planning Framework. Columbia (SC): SC Department of Natural Resources. 2019 Oct. http://hydrology.dnr.sc.gov/pdfs/basin-planning/SC_Water_Planning_Framework.pdf.
- Carbone GJ, Dow K. Water resource management and drought forecasts in South Carolina. Journal of the American Water Resources Association. 2007;41(1):145–55. https://onlinelibrary.wiley.com/doi/10.1111/j.1752-1688.2005.tb03724.x.
- GAO. Freshwater supply: states’ views of how federal agencies could help them meet the challenges of expected shortages. Washington (DC): United States General Accountability Office (GAO); 2003 July. Report to Congressional Requesters: GAO-03-514.
- South Carolina Water Use Report 2020 Summary. Columbia (SC): SC Department of Health and Environmental Control. 2021 Aug. https://scdhec.gov/sites/default/files/media/document/BOW_2020_South_Carolina_Water_Use.pdf.
- Irrigation Water Use. Reston (VA): United States Geological Survey. [accessed 2021 Apr 20]; https://www.usgs.gov/mission-areas/water-resources/science/irrigation-water-use?qt-science_center_objects=0#qt-science_center_objects.
- SC Active Mines Viewer. Columbia (SC): SC Department of Health and Environmental Control. [accessed 2021 Feb 2]; https://gis.dhec.sc.gov/activeminesviewer/.
- Information about Public Water Systems. Washington (DC): United States Environmental Protection Agency. [accessed 2021 Feb 2]; https://www.epa.gov/dwreginfo/information-about-public-water-systems.
- Private Well Program Annual Report 2019–2020. Columbia (SC): SC Department of Health and Environmental Control. https://scdhec.gov/sites/default/files/media/document/Private%20Wells%20Program%202019-2020%20Annual%20Report.pdf.
- Willis DB, Straka TJ. The economic contribution of natural resources to South Carolina’s Economy. Clemson (SC): Clemson University Experiment Station; 2016 Dec. FW 13. https://www.dnr.sc.gov/economic/EconomicContributionsSC.pdf.
- South Carolina Water Use Report 2021 Summary. Columbia (SC): SC Department of Health and Environmental Control. 2022 Jun. https://scdhec.gov/sites/default/files/media/document/2021_WUR_FINAL.pdf
- South Carolina Water Use Report 2017 Summary. Columbia (SC): SC Department of Health and Environmental Control. 2018 Aug. https://scdhec.gov/sites/default/files/media/document/Water%20Use%20Report%20Summary%202017.pdf.
- South Carolina Water Use Report 2018 Summary. Columbia (SC): SC Department of Health and Environmental Control. 2019 May. https://scdhec.gov/sites/default/files/media/document/South%20Carolina%20Water%20Use%20Report%202018%20Summary%20%281%29.pdf
- South Carolina Water Use Report 2019 Summary. Columbia (SC): SC Department of Health and Environmental Control. 2020 Sep. https://scdhec.gov/sites/default/files/media/document/2019_South_Carolina_Water_Use_Report.pdf
- Census Survey Explorer. Washington (DC): United States (US) Census Bureau. [accessed 2022 Dec 19]. https://www.census.gov/data/data-tools/survey-explorer/.
- Quick Facts South Carolina. Washington (DC): US Census Bureau. [accessed 2022 Dec 19]. https://www.census.gov/quickfacts/fact/table/SC/INC110221.
- Home Water Use in the United States. Washington (DC): National Environmental Education Foundation. [accessed 2022 Dec 19]. https://www.neefusa.org/weather-and-climate/weather/home-water-use-united-states#South%20Carolina.
Additional Resources
Nix HB, Rouhi Rad M. Water withdrawal regulation in South Carolina. Clemson (SC): Clemson Cooperative Extension, Land-Grant Press by Clemson Extension; 2022 Apr. LGP 1143. https://lgpress.clemson.edu/publication/water-withdrawal-regulation-in-south-carolina/.
Nix HB, Rouhi Rad M. An introduction to consumptive use of water in South Carolina. Journal of South Carolina Water Resources. 2023;9(1):60–67. https://tigerprints.clemson.edu/jscwr/vol9/iss1/10/.
SC Department of Health and Environmental Control Annual Water Use Reports: https://scdhec.gov/bureau-water/surface-water-withdrawals.