Introduction
One of the most critical factors in growing a successful soybean crop is the nutrient status during the life cycle. Tissue sampling is a tool to diagnose suspected plant nutritional problems (diagnostic) as well as monitor the overall effectiveness of the fertility program (predictive). This publication explains how soybean producers should sample for diagnostic and predictive reasons.
Routine tissue sampling of crops aids in monitoring the nutritional status and also detects nutritional deficiencies of the crop during the growing season. This data is used as a tool to monitor and improve a producer’s fertility program. Although this practice can be labor-intensive and time-consuming, it can be a beneficial tool for the operation’s long-term success. This form of tissue sampling is beneficial in many high-yielding and high-value crops such as soybeans. Tissue sampling is also commonly used as a diagnostic tool to help the producer detect and/or confirm a nutrient deficiency in the soybean crop. A diagnostic test can sometimes be useful in determining the cause of the deficiency, but often it is too late at that point. The deficient nutrient(s) determine if the issue can be rectified. For example, phosphorus deficiency is harder to remediate during the current growing season. Predictive sampling (sampling that is conducted on visually healthy plants) can be used for preventing problems, while diagnostic sampling (sampling when there is evidence of an issue) is more useful in emergency situations to identify the problem and determine a solution.
Regardless of the crop being grown, plant tissue sampling does not replace soil sampling for developing the foundation of a fertility program. A tissue sampling program’s full benefit and effectiveness are only achieved when used in conjunction with a soil sampling program. A tissue sample analysis measures macronutrient and micronutrient concentration within the sample and compares those concentrations to established sufficiency levels. Low tissue nutrient concentrations are not always due to soil fertility as other factors such as soil pH, soil compaction, herbicide damage, wet conditions, drought, cloudiness, insect damage, and disease can affect nutrient uptake in the plant.1 These factors may result in the crop being deficient, even when there are plenty of available nutrients in the field. Tissue sampling is one of the many steps in the process of determining the cause of a problem. As with any crop issue, producers must determine the cause before trying to address the problem.
Tissue Sampling as a Diagnostic Tool
For an accurate diagnosis, the correct plant parts must be collected for testing. Collecting the correct plant part is dependent on the growth stage of the soybean plant (tables 1 and 2). Sample the entire aboveground portion of the soybean plant if sampling plants in the seedling to early vegetative stage of growth. Collect twenty-five to thirty plants in the area to be sampled. Collect the most recent, matured trifoliate leaves (not including the petiole) from one of the top three or four nodes of the plant if sampling during the late vegetative stages (V3) to early reproductive stages (R1 or R2). The sampling should be performed on twenty to twenty-five plants that are exhibiting a problem.
Table 1. Explanation of soybean vegetative growth stages.2
| Growth Stage | Explanation |
| VE – Emergence | Emergence – cotyledons have been pulled through the soil surface |
| VC | Unrolled unifoliolate leaves – unfolding of the unifoliolate leaves |
| V1 | First trifoliate – one set of unfolded trifoliate leaves |
| V2 | Second trifoliate – two sets of unfolded trifoliate leaves |
| V4 | Fourth trifoliate – four unfolded trifoliate leaves |
| V(n) | nth trifoliate – V stages continue with the unfolding of trifoliate leaves, the final number of trifoliate leaves depends on the soybean variety and the environmental conditions |
Table 2. Explanation of soybean reproductive growth stages.2
| Growth Stage | Explanation |
| R1 | Beginning flowering – plants have at least one flower on any node |
| R2 | Full flowering – there is an open flower at one of the two uppermost nodes |
| R3 | Beginning pod – pods are 3/16 inch (5 mm) at one of the four uppermost nodes |
| R4 | Full pod – pods are 3/4 inch (2 cm) at one of the four uppermost nodes |
| R5 | Beginning seed – seed is 1/8 inch long (3 mm) in the pod at one of the four uppermost nodes on the main stem |
| R6 | Full seed – pod containing a green seed that fills the pod capacity at one of the four uppermost nodes on the main stem |
| R7 | Beginning maturity – one normal pod on the main stem has reached its mature pod color |
| R8 | Full maturity – 95% of the pods have reached their full mature color |
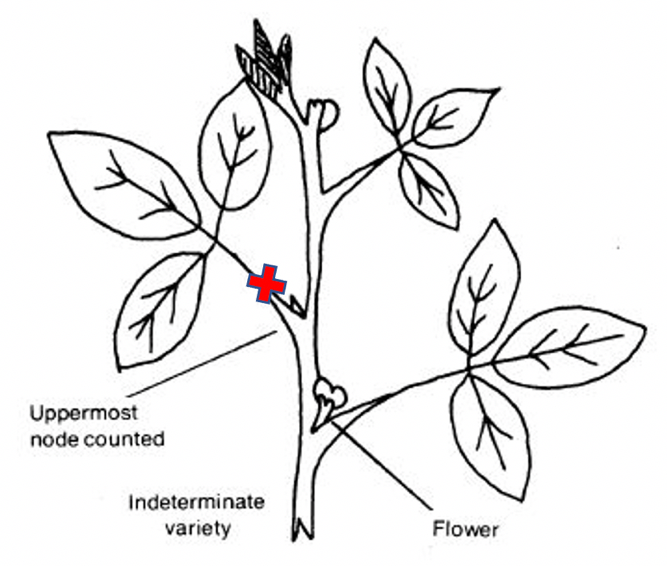
Figure 1. When sampling during the V3 to R1-R2 growth stage, sample fully expanded trifoliate leaves (top three or four nodes) excluding the petiole. Image credit: Chris Talley, Clemson University.
In addition to collecting samples from suspect plants, a separate sample should be collected for analysis from healthy plants in a different area of the field. Sampling only problem plants may not provide the most accurate results as they may have been nutrient-deficient for an extended period and thus may not represent current nutrient availability in the field. Results from healthy plants provide a better assessment of the potential nutrient issues affecting the soybeans. If soybeans in the same field are just beginning to show signs of nutrient deficiency, collect and submit a sample as well. Having all three samples will give a good comparison of healthy soybeans, problem soybeans, and soybeans in between. Ensure that the samples are correctly labeled as to which portion of the field they were taken from. In addition to the tissue samples, soil samples should also be taken next to the same plants. The soil samples will help determine fertility status in the field and the ultimate cause of the nutritional problem. As with the tissue samples, the soil samples should be labeled appropriately to correspond with the tissue samples taken from the field.
Besides allowing for making in-field comparisons, collecting two to three different samples in the field allows for comparison against the sufficient nutrient range (tables 3, 4a, and 4b).3 Soybean tissue nutrients may register slightly lower or higher than the range and still not show signs of deficiency or toxicity.
Table 3. Suggested macronutrient sufficiency ranges (%) for early growth (V-V3) of soybeans.3
| Macronutrients
N |
Macronutrients
P |
Macronutrients
K |
Macronutrients
Ca |
Macronutrients
Mg |
Macronutrients
S |
| 3.5%–5.5% | 0.30%–0.60% | 1.7%–2.5% | 1.1%–2.2% | 0.30%–0.60% | – |
Table 4a. Suggested macronutrient sufficiency ranges (%) for flowering stages (R1-R2) of soybeans based on samples from fully expanded trifoliate leaves from the top three or four nodes.3
| Macronutrients
N |
Macronutrients
P |
Macronutrients
K |
Macronutrients
Ca |
Macronutrients
Mg |
Macronutrients
S |
| 3.25%–5.0% | 0.30%–0.6% | 1.5%–2.25% | 0.8%–1.4% | 0.25%–0.7% | 0.25%–0.60% |
Table 4b. Suggested micronutrient sufficiency ranges (%) for flowering stages (R1-R2) of soybeans based on samples from fully expanded trifoliate leaves from the top three or four nodes.3
| Micronutrients
Fe |
Micronutrients
Mn |
Micronutrients
Zn |
Micronutrients
Cu |
Micronutrients
B |
| 25%–300% | 17%–100% | 21%–80% | 4%–30% | 20%–60% |
Tissue Sampling as a Monitoring Tool
Often in high yield situations or situations where the overall fertilization program is being evaluated, it can be beneficial to use tissue sampling as a monitoring or predictive tool. When using tissue sampling in a monitoring/prediction situation, sample during the early reproductive stage (R1-R2) and compare to the reference sufficiency ranges found in table 4a and 4b. If a specific tissue nutrient is high, consider reducing the amount of the nutrient fertilizer applied. If a specific tissue nutrient is low, confirm with a soil test. If a soil test shows a high concentration, then there may be other factors (for example, soil compaction or soil pH) that might be impacting the plant’s capacity to uptake the nutrient. If the soil test confirms a low soil nutrient status, consider increasing the amount of nutrient fertilizer. The most significant benefit of the monitoring approach is to keep records of tissue samples over many years for each field so that the fertilization program can be evaluated and the utilization of the nutrients can be assessed.
Sample Handling and Collection
Accurate results from a tissue sample will depend significantly on how the samples were collected and handled before being received at the lab. See the Tissue Sampling as a Diagnostic Tool section above for the number of plants and plant parts to collect for sampling. Soybean samples should be free of soil contamination. Place the samples in clean paper bags or envelopes. If samples are wet, keep bags or envelopes open to allow samples to dry before shipping. To prevent decomposition during transit, never place tissue samples in plastic bags. Make sure to label all samples properly. In diagnostic sampling, producers should label each sample from the field correctly so that samples can be separated between “good,” “bad,” and “transition” parts of the field. Samples may be brought to your local Clemson Cooperative Extension office to be processed and sent to the Clemson University Agricultural Service Lab.
Summary
Tissue sampling should never be used in place of soil sampling for developing a fertilization program for soybeans. A tissue sample represents a single time point and may not be an accurate representation of the plant’s nutrient utilization over the whole season. Tissue samples are of the greatest use in diagnosing potential nutrient deficiencies or toxicities. They can aid in monitoring the nutrition of the soybean during the growing season and utilized in evaluating the overall fertilization program. Caution should be taken to ensure that proper collection and handling procedures are followed for the sampling process. For help interpreting results, please contact your local County Extension Office. The Clemson University Agricultural Service Lab provides sufficiency nutrient ranges for soybeans as well as other crops.
References Cited
- Bennett WF. Nutrient deficiencies and toxicities in crop plants. APS Press; 1993.
- Licht M. Soybean growth and development. Ames (IA): Iowa State University Extension and Outreach; 2014. PM 1945.
- Sabbe WE, Lessman GM, Bell PF. Reference sufficiency ranges for plant analysis in the southern region of the United States. Raleigh (NC): NC Department of Agriculture and Consumer Sciences, Southern Cooperative Series Bulletin; 2000. Regional Project SERA-IEG-6, SCSB #394.
References Consulted
Plank CO, editor. Plant analysis reference procedures for the southern region of the United States. Raleigh (NC): NC Department of Agriculture and Consumer Sciences, Southern Cooperative Series Bulletin; 1992. SCSB #368.
Ruiz Dian DA, Martin KL, Mengel DB.
Diagnosing nutrient deficiencies in the field. Manhattan, KS: Kansas State Research and Extension; 2011. MF3028.