From 2000 to the present, the dairy herd across the United States has declined and with it, the number of operations. The number of milk cows across the Southeast has fallen dramatically. This publication provides concise, up-to-date information about the size of the South Carolina dairy herd and the number of operations to summarize the changes over the last twenty years. An overview of key issues for South Carolina dairy operations, remaining challenges, and resources to help dairy operators stay informed in an ever-changing market environment are also included.
Herd Size and Operations
It is no surprise to many that the dairy herd in South Carolina has declined; what perhaps is surprising is that the state lost 53% of its milk cows from 2003 to 2022, and with it, 75% of the licensed operations (see figure 1).1 The number of licensed operations fell from 120 in 2003 to 80 in 2013 and 30 as of 2022.1 This trend is consistent with declining dairy herds across the United States and, particularly, the Southeast. For reference, over this period, the number of milk cows in the United States increased by approximately 3.5% (320,000 head), and the number of operations decreased by 62% (46,178).1 As evidenced by the number of operations falling faster than the number of milk cows, the number of animals per operation has increased. The average farm herd size has increased while the number of individual operations has fallen. These changes have implications for on-farm management and investment decisions as well as marketing considerations.
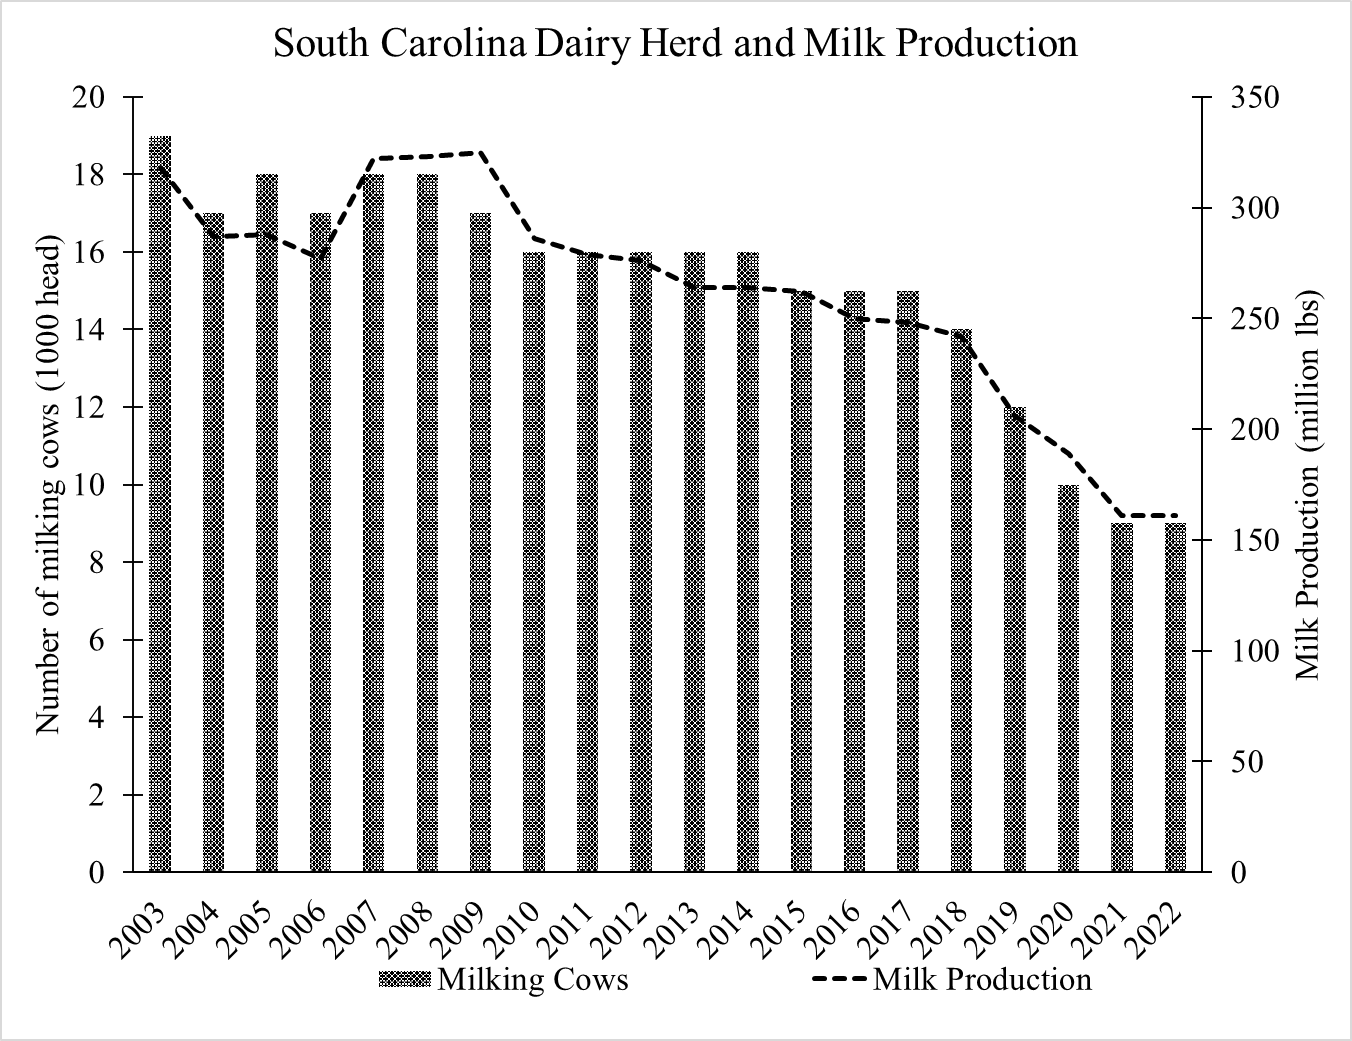
Figure 1. Trends in the number of milk cows and milk production in South Carolina from 2003 to 2022.1 Image credit: Anastasia Thayer, Clemson University.
Milk Production
While the dairy industry (milk cows and operations) in South Carolina declined between 2003 and 2023, it is not completely clear how it has impacted total milk production. Across the United States, sustained milk production and increased milk production per cow have allowed for increased domestic milk production with only moderate increases in cow numbers. Milk output increased 1.53% annually from 2000 to 2020, with some states increasing by as much as 3.52% to 4.4%.2 It is worth noting that milk production is the primary source of revenue for most dairy operations, and the sale of bull calves is the second. In South Carolina, milk production declined 49% from 2002 to 2023, consistent with the decline in cows (figure 1). However, it is important to note that herd age and individual animal productivity can impact milk production. For example, for a few years, from 2007 to 2009, milk production per cow increased while the number of cows declined. Conversely, from 2011 to 2014, herd size stayed relatively constant or increased while production per cow declined. Some of the observed trends can likely be explained by animal age and changing herd demographics. However, the changes highlight that while the number of milk cows is an important indicator of overall industry size, productivity and efficiency are also important components of production and, in turn, revenue.
Current Challenges
Some of the sustained challenges dairy operations in the Southeast face are the result of issues related to the environment and others based on current policies, markets, or human-created concerns. These challenges include productivity, labor and aging out, market orders and processing, and market volatility and demand.
Productivity
In an age of production efficiency supported by research demonstrating differential efficiency gains for interventions based on herd size, understanding the limits to technological progress through genetics or selective breeding is important.2 Unlike in other US states or the broader US dairy industry where substantial gains in per cow production were realized, or even moderate gains have become normal, South Carolina stands out because the industry has seen declining production that largely mirrors declining numbers of milk cows. This, coupled with a smaller-than-average herd size for a given operation, highlights distinct regional challenges. While gains in productivity could bring increases in revenue, operators should also pay attention to differences in costs seen across herd sizes.3 Specifically, South Carolina operators should critically evaluate the suggested gains in production that can be brought from genetics, selective breeding, technology adoption, feed mix, or even the impact of weather and extreme events. Heat stress is widely known to reduce milk production, especially in the humid and heat wave-prone Southeast climate.
Labor and Aging Out
While feed remains the most considerable expense in production costs, finding, managing, and retaining appropriate labor remains challenging for many operators, especially small operators. The employment of nonfamily and immigrant labor is essential to ensuring that on-farm tasks are completed. However, large variations occur among farms and across farm sizes when considering the prevalence of nonfamily and immigrant labor, and as immigrant labor increases, so does labor instability and precarity.4 In addition to simply finding and retaining workers, part of the labor challenge for the dairy industry continues to be the aging out of operators. As operators continue to age, managing on-farm tasks becomes more difficult, but choices exist for the best management of day-to-day operations. The timing of investment decisions, business structure, and succession planning all play an essential role in determining the most appropriate choices for a given operation.
Marketing Orders and Processing
South Carolina, along with North Carolina and parts of neighboring states, falls under the Appalachian milk marketing order. Generally, the Southeast is considered a milk deficit region, and both the Appalachian and Southeast marketing orders include transportation credits.5 South Carolina also has a refundable milk credit for operators when milk sale prices fall below certain thresholds.6 While the milk marketing orders and policies exist to support milk production throughout the Southeast, as the regional impact of reduced milk cows and operations is realized, these policies may need to be revisited, particularly as they relate to processing capacity and locations, diversion limits, transportation credits, and delivery day requirements. Most recently, the US Department of Agriculture (USDA) made recommendations in early December 2023 addressing transportation credits in the Appalachian and Southeast orders to respond to a continued decline in milk availability in the Southeast. The recommendations focused on increasing the compensation amounts and calculation for transportation credits for milk coming into the region.7
Market Volatility and Demand
From 2015 to 2022, the nominal all-milk price for South Carolina fluctuated from a low of $17.40 in 2018 to a high of $28.60 in 2022.8 This wide range of prices highlights continued challenges for the management of revenue as well as decision-making regarding investments, enrollment, and coverage selection into risk management programs. Due to several factors, including continued volatility in feed markets, milk prices will likely continue to fluctuate. At the same time, consumer demand for milk and dairy will likely continue to impact prices. Finally, operators should not ignore international dairy markets and how trade policy impacts dairy demand. They must understand their operation within a highly volatile market environment and account for these variables when making decisions. It is also important to note that even though all-milk prices may be high, this does not directly correlate to higher profit. This is especially true when considering the cost of inputs such as feed, vet care, and labor may also be high.
Remaining Issues and Opportunities
In a rapidly changing industry, operators may feel pressure to respond by changing production practices, expanding, or looking to other riskier investments to maintain profitability in an ever-changing market. The topics and resources provided below will help operators make informed decisions for their operations.
Timing Financial Investment and Farm Financial Health
In the last few years, increased market volatility and interest rates not seen in decades significantly changed the financial landscape. As a result, financial analysis and decision-making based on economic indicators are critical. Budgeting and using financial ratios and what-if scenarios can show the impact of market-level conditions and on-farm decision-making.
Resources
- Visit the Clemson Extension Agribusiness Program Team website to find contact information for your local Agribusiness Agent and additional topical information and education.
- Contact a private consultant.
Value-Added Products and Expansion
Operators might be tempted to try and find the next best marketing opportunity or expand production to match competitors. While it has been shown that larger operations are more productive and benefit from efficiency gains, there are region- and operation-specific aspects that are important to consider. No matter the existing farm size, expansion decisions or decisions to change marketing strategies should be based on reasonable financial assumptions and market analysis. Especially given post-COVID trends and interest in alternative marketing strategies, the recommendation to adopt direct-to-consumer marketing is not for every operator. These decisions should be informed by operation-specific analysis and subject to robust sensitivity analysis to ensure that the opportunity persists longer than any investment loans. These may include various agrotourism options (e.g., a creamery selling butter, cheeses, ice cream, etc.).
Resources
- USDA Rural Development, “Value-Added Producer Grants”
- PennState Extension, “Value-Added Agriculture: Dairy Products”
Labor and Robotics
As previously discussed, labor continues to be a challenge for dairy operations with increases in agricultural labor wages, turnover, and aging out of operators. Labor efficiency is a key factor in profitable dairies and is associated with favorable financial indicators.9 Robotic milking systems offer promise for increased production and reduced labor needs. While costs have decreased in recent years and changes have occurred in the contracting for operators, further on-farm and investment analyses are recommended before making adoption decisions.
Resources
- University of Kentucky, Department of Animal & Food Sciences, “What do I Need to Consider before Investing in a Robotic Milking System?”
- University of Minnesota Extension, “Do Milking Robots Pay?”
Risk Management Products and Margins
Risk management programs such as the Dairy Margin Coverage program offer operators the opportunity to pay a premium to enroll production into coverage levels that would provide compensation if the milk margin fell below specific thresholds. A recent study of such programs in Wisconsin shows that farm-level milk and national milk margins are not always correlated.10 Additionally, larger dairy farms are more likely to enroll in risk management programs such as Dairy Margin coverage and more likely to make coverage decisions that increase net returns.11
Other risk management products available through the USDA include the Dairy Revenue Protection and Livestock Gross Margin Insurance Dairy Cattle programs. Operators should compare products, coverage, and premiums under varying market assumptions. In some cases, Dairy Margin Coverage will be more attractive, whereas Dairy Revenue Protection or Livestock Gross Margin Insurance could be more appropriate. As program enrollment opens, considerations should be made regarding enrollment in risk management programs and the maximization of net returns due to the possibility of programmatic changes under the new farm bill.
Resources
- USDA Farm Service Agency, “Dairy Margin Coverage Program”
- Program on Dairy Markets and Policy website, dmc.dairymarkets.org
- USDA Risk Management Agency, “Livestock Gross Margin Insurance Dairy Cattle Fact Sheet”
- USDA Risk Management Agency, “Dairy Revenue Protection Fact Sheet”
Climate, Seasonal Patterns, and Productivity
As previously discussed, South Carolina and the Southeast have not seen dramatic increases in per-cow milk production as experienced by other states. One such reason could be heat stress, which is expected to continue and become more pronounced throughout the South.12 Operators likely need to adjust productivity expectations and/or take additional steps to reduce heat stress.
Resources
- University of Florida, IFAS Extension, “Methods to Relieve Heat Stress for Florida Dairies”
- PennState Extension, “Heat Stress Abatement Techniques for Dairy Cattle”
- USDA Economic Research Service, “Changing Structure, Financial Risks, and Government Policy for the U.S. Dairy Industry“
References Cited
- USDA, ESMIS. Milk Production. Washington (DC): United States Department of Agriculture, National Agricultural Statistics Service; 2024 [accessed 2024 January 4]. ISSN: 1949-1557. https://usda.library.cornell.edu/concern/publications/h989r321c?locale=en.
- Njuki E. Sources, trends, and drivers of US dairy productivity and efficiency. Washington (DC): United States Department of Agriculture, Economic Research Service; 2022 [accessed 2024 January 9]. Economic Research Report No. (ERR-305). 52 p. https://www.ers.usda.gov/publications/pub-details/?pubid=103300.
- MacDonald JM, Cessna J, Mosheim R. Changing structure, financial risks, and government policy for the US dairy industry. Washington, DC: United States Department of Agriculture Economic Research Service; 2016 [accessed 2024 January 9]. Economic Research Report No. (ERR-205). 75 p. https://www.ers.usda.gov/publications/pub-details/?pubid=45522.
- Schewe R, White B. Who works here? Contingent labor, nonfamily labor, and immigrant labor on U.S. dairy farms. Social Currents. 2017 Oct;4(5):429–447. doi:10.1177/2329496516686539.
- Townsend O, Burdine K, Mark T. The unique qualities of the southern milk marketing orders. Lexington (KY): University of Kentucky, College of Agriculture, Food and Environment, Department of Agricultural Economics; 2017 Sept [accessed 2024 January 9]. Agricultural Economics Extension Series Number: 2017-12. https://agecon.ca.uky.edu/files/extunmilkqual12.pdf.
- State of South Carolina Department of Revenue. I-334: Milk credit. Columbia (SC): State of South Carolina Department of Revenue; 2012 Jul [accessed 2024 January 9]. https://dor.sc.gov/forms-site/Forms/I334.pdf.
- Milk in the Appalachian, Florida, and Southeast Marketing Areas; Final Decision on Proposed Amendments to Marketing Agreements and to Orders, 80 Fed. Reg. 84038–84065 (proposed December 1, 2023) [accessed 2024 January 9] (to be codified at 7 CFR 1005/1006/1007). https://www.federalregister.gov/documents/2023/12/01/2023-25879/milk-in-the-appalachian-florida-and-southeast-marketing-areas-final-decision-on-proposed-amendments.
- Milk Production and All Milk Price. Washington (DC): United States Department of Agriculture, National Agricultural Statistics Service; 2022 [accessed 2024 Jan]. https://www.nass.usda.gov/Surveys/Guide_to_NASS_Surveys/Milk/index.php.
- Yi J, Ifft J. Labor use efficiency and New York dairy farm financial performance. Agricultural Finance Review. 2019 [accessed 2024 Jan 9];79(5):646–665. https://www.emerald.com/insight/content/doi/10.1108/AFR-02-2019-0016/full/html.
- Skevas T, Thompson W, Brown S, Cabrera VE. Milk income over feed cost margin, margin protection program, and farm finances for a sample of Wisconsin Dairies in 2000–2017. Applied Economic Perspectives and Policy. 2021 [accessed 2024 Jan 9];43(4):1638–1657. https://onlinelibrary.wiley.com/doi/full/10.1002/aepp.13108. doi:10.1002/aepp.13108.
- Yu J, Gabrielyan GT. Do large farms make better choices: evidence from dairy margin coverage program participation patterns. Applied Economic Perspectives and Policy. 2023 [accessed 2024 Jan 9];45(4):2235–2254. https://onlinelibrary.wiley.com/doi/full/10.1002/aepp.13358. doi:10.1002/aepp.13358.
- USDA, ERS. Climate Change, Heat Stress, and U.S. Dairy Production. Washington (DC): United States Department of Agriculture, Economic Research Service; 2014 Sep. Economic Research Report No. (ERR-175) 45 p. https://www.ers.usda.gov/publications/pub-details/?pubid=45282.