Informed decision-making on the sustainable management of waterbodies such as streams, rivers, and lakes entails understanding various watershed processes (e.g., land-use changes, urbanization, climate change, point and non-point source impacts) and their effects on water quantity and quality. This publication describes commonly used watershed models suitable as decision support tools, particularly models used to address water quality issues. The publication will benefit Extension agents, natural resources managers, land developers, and researchers focused on watershed activities and water quality modeling. For a deeper understanding, the authors highly recommend readers of this publication review the scientific literature pertinent to the models recommended in table 1.
Introduction
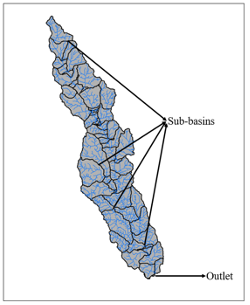
Figure 1. Reedy River watershed with its sub-basins. Image credit: Ibrahim Busari, Clemson University.
A watershed is a topographically delineated area drained by a stream system. A watershed serves as a management and planning unit, and its boundaries may span an extensive range of environments, political jurisdictions, and spatial and temporal scales.1 A watershed can also be an ideal socio-economic unit for planning and implementing policy management actions. The impacts of natural and anthropogenic activities, such as pollution, deforestation, and flooding on landforms, can be observed and managed at the watershed level. A watershed is also referred to as a catchment and could comprise smaller watersheds known as sub-basins. Readers of this publication are further advised to review the Collection and Delineation of Spatial Data book by United States Geological Survey (USGS)2 for a detailed description of watersheds based on the scale of observation (figure 1).
Watershed Water Quality Models
Generally, hydrologic models are essential for understanding hydrological processes such as precipitation, evaporation, and infiltration, which are important for predicting water quantity and quality. At the watershed scale, watershed modeling represents processes in the watershed with an assemblage of mathematical equations, structure, and architecture determined by the objective under study.3 Watershed water quality modeling involves simulation such as rainfall-runoff transformation, erosion of upland soil and stream bed and banks, sedimentation, and fate and transport of chemicals and bacteria in water bodies.4 Water quality models are used to understand hydrological processes and their influence on water quality. These models are increasingly used to observe how land use changes, climate change, and Best Management Practices (BMPs) impact the health of water bodies.5 Water quality models are considered a decision-making tool to predict the fate of contaminants in a watershed, determine the requirements for meeting water quality standards, and support water quality management.6
Water quality models are generally classified based on the processes involved in the simulation as empirical, conceptual, and physical/process-based/mechanistic models. Empirical models are observation-oriented models that are also known as data-driven models. They predict watershed responses using existing data without considering features and processes in the watersheds.7 Conceptual models describe all watershed processes perceived as necessary at the catchment scale with input and output relationships. Physically-based models represent watershed processes using numerical approaches using a mathematical-physical form.8 Based on the spatial description, water quality models can be described as lumped and distributed models, although some are semi-distributed. Spatial variability is ignored in lumped models, and watershed characteristics are treated as uniform. However, distributed models consider the spatial variability in the watershed, such as vegetation and soil, and are typically somewhat complex. Lumped models are usually conceptual, while distributed models are physical-based.9
Why Watershed Water Quality Models?
The planning and distribution of water, an essential resource for existence, is often done at the watershed scale. The proper delineation and characterizations of different watersheds enable the observation of water dynamics in varying environmental, economic, human-caused, climatic, and natural conditions. Water quality defines water usage for various purposes by measuring its physical, chemical, and biological properties. Agriculture, urbanization, and industrialization may directly or indirectly compromise water quality. Change in land use, such as increased impervious surface area, results in higher runoff due to decreased infiltration and favors the swift migration of contaminants into water bodies (figure 2).10
Agricultural and urban contaminants (e.g., sediment, fertilizers, pesticides, metals, oils, etc.) can be transferred into surface waters through overland flow and drainage channels via point and non-point sources. These contaminants, whether released by agricultural producers or urban communities, can lead to impairment of water bodies and cause eutrophication, leading to conditions unfavorable for aquatic life and endangering ecosystem health.11 Point source pollution is defined by the United States Environmental Protection Agency (EPA)12 as:
“…any discernible, confined, and discrete conveyance, including but not limited to any pipe, ditch, channel, tunnel, conduit, well, discrete fissure, container, rolling stock, concentrated animal feeding operation, or vessel or other floating craft, from which pollutants are or may be discharged. This term does not include agricultural stormwater discharges and return flows from irrigated agriculture.”
Contaminant sources that cannot be identified and are diffuse by nature, such as irrigation return flow and runoff from most agricultural production areas, are considered non-point sources. Point sources such as wastewater discharges and stormwater outfalls are easily identified, and the management of outflows from point sources is regulated. Compared to the management of flows and contaminants from point sources, management of flows and associated contaminants from non-point sources is challenging due to their diffuse nature.10,11
Water quality models help quantify the impacts of natural and anthropogenic activities, climate, and point and non-point source contaminants on aquatic ecosystems. Efficient water quality modeling entails using tools that consider watershed processes (anthropogenic and natural) and simulate the flow and transport of contaminants into water bodies to predict catchment responses to past, present, and future conditions.5
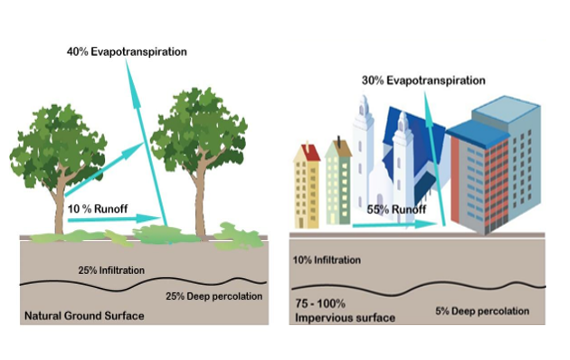
Figure 2. Land use change and effect on some components of the hydrologic cycle. The left block shows that with increased forests and vegetation, evapotranspiration and infiltration are increased while surface runoff is decreased. The right block, however, shows increased surface runoff and reduced infiltration triggered by urbanization and the loss of forests. Image credit: Ibrahim Busari, Clemson University. Adapted from the United States Environmental Protection Agency (2003, EPA 841-F-03-003).12
Data Requirements for Watershed Water Quality Models
Watershed water quality models are data-intensive models. The success of these models often depends on the integrity of the input data. These data can be obtained from literature and measured directly from the field. Various physical, chemical, and biological parameters characterize freshwater systems:
- Physical parameters: flows, temperature, turbidity
- Chemical parameters: bicarbonates, calcium, chloride, dissolved oxygen (DO), heavy metals, magnesium, nutrients (e.g., nitrogen and phosphorus), potassium, sodium, sulfates, suspended solids, total dissolved solids (TDS)
- Biological parameters: biochemical oxygen demand (BOD), bacteria/coliforms, algae concentration, and other constituents
Water quality parameters are analyzed using models, usually dependent on project objectives, the waterbodies to be investigated, and data availability and quality.13 Efficient simulation also requires other critical information, including baseline conditions (standard conditions free of contamination), contaminant sources, flow characteristics, waterbody geometry, bathymetric, and meteorological data.14
Description of Widely Used Watershed Water Quality Models
The following sections describe a few watershed water quality models often used to model the impacts of watershed activities on water quality. The major principles behind the development of these models are the law of conservation of energy, mass, and momentum.13 The chosen models are selected because they are freely available and are widely used in published scientific studies. Regulatory agencies often use these models for effective decision-making depending on the water quality question.
AQUATOX
AQUATOX is an ecosystem model developed by the EPA to predict and monitor the fate and effects of contaminants in aquatic ecosystems.5 AQUATOX may be applied in tank ponds, streams, small rivers, lakes, reservoirs, and estuaries. AQUATOX has been used to simulate the effect of different environmental stressors, including nutrients, sediment, organic waste, toxic substances, phytoplankton, and macrophytes in water bodies.15 However, the limitation of this model is its complexity.14
CE-QUAL-W2
CE-QUAL-W2 is a 2-dimensional water quality and hydrodynamic model for estuaries, lakes, reservoirs, and rivers. The model can simulate water quality parameters, nutrients, and eutrophication variables such as pH, total organic carbon, dissolved organic carbon, total organic nitrogen, total organic carbon, BOD, E. coli, and multiple algae. The primary limitation of the model is the simulation of the sediment kinetics in the sediment-water interface due to the intensive data required to drive the model. The model could also be computationally and data intensive.
Environmental Fluid Dynamics Code (EFDC)
The Environmental Fluid Dynamics Code (EFDC) is a hydrodynamic and water quality model initially developed by the Virginia Institute of Marine Science and later sponsored by the EPA. EFDC can simulate the hydrodynamic process, temperature stratification, sediment transport, pollutant load estimation, and water quality prediction in water bodies.16 EFDC considers factors such as vegetative resistances, hydraulic structures, and meteorological conditions. However, the model cannot simulate numerous phytoplankton species nor evaluate competition among various algal communities.
Hydrologic and Water Quality Systems (HAWQS)
Hydrologic and Water Quality Systems (HAWQS) is an interactive web-based modeling system that simulates water quantity and quality using the SWAT model (described later in the article).17 HAWQS provides a user-friendly interface to monitor the effectiveness of management practices, cropping techniques, farming systems, land uses, vegetation types, and other hydrological scenarios on freshwater dynamics. HAWQS can simulate the dynamics of sediment, nutrients, pathogens, pesticides, and parameters such as BOD, DO, and temperature in freshwater bodies. HAWQS allows the selection of different watershed scales and can perform simulations at daily, monthly, or annual timesteps. The input data are derived from databases such as the National Land Cover Dataset, STATSGO soils data, the National Inventory of Dams, the National Hydrography Dataset, and the National Agricultural Statistics Service.17
Hydrological Simulation Program – Fortran (HSPF)
The Hydrological Simulation Program – Fortran (HSPF) is a process-based distributed watershed model formerly known as Stanford Watershed Model, developed in the 1960s to simulate watershed processes.3 HSPF simulates non-point source runoff and pollutant loading and is a valuable tool for observing the fate of chemicals and pollutants from different land-use types in receiving water bodies.18 However, the model cannot explicitly simulate agricultural conditions such as crop rotations, specific BMPs, and wetland processes.18 HSPF also requires extensive calibration and a high level of expertise for practical application
Loading Simulation Program C++ (LSPC)
The Loading Simulation Program C++ (LSPC) is a watershed model designed by streamlining the algorithms of HSPF using C++ to simulate water quality, transport, and sediment processes. LSPC can simulate surface runoff and subsurface flows in small and large watersheds in hourly timesteps. LSPC is a flexible and efficient water quality model developed to facilitate, organize, and manage data for modeling complex systems.19 The output of this model can be coupled with other instream water quality models like WASP and CE-QUAL-W2 for effective monitoring of loading effects on water quality. LSPC is limited by its inability to model routing to simulate the interconnection between surface and ground waters.20
QUAL2K
The EPA developed the first version of the QUAL2K model (QUAL2E) in 1968 to predict contaminant dynamics in river stretches and well-mixed lakes. Their effects on DO concentrations are predicted by assuming the water body to be one-dimensional.14 Depending on the user’s need, the model can simulate DO, BOD, temperature, algae as chlorophyll-a, organic nitrogen as N, nitrite as N, nitrate as N, organic phosphorus as P, dissolved phosphorus as P, and coliform bacteria. Due to the steady state assumption of the model, it is, however, challenging to model variable flow conditions.21
Soil Water and Assessment Tool (SWAT)
The Soil Water and Assessment Tool (SWAT) is a physically-based model developed by the United States Department of Agriculture Research Service to predict the impacts of best management practices on rural and agricultural environments.5 The model was developed in the early 1990s to predict the effect of management activities such as planting, irrigation, tillage, grazing, and harvesting techniques on water, sediments, and agricultural yields in complex watersheds.22 SWAT also divides each watershed into sub-basins and can subdivide the sub-basins into smaller spatial units called hydrologic response units (HRU) to capture variation in watershed characteristics.14 The limitations of this model include (1) lack of suitability for simulating forest dynamics,23 (2) significant errors in predicting soluble phosphorus and nitrate loading in snow-dominated regions,24 and (3) program complexity (management and modification) when dealing with numerous HRUs from large watersheds.
Water Quality Analysis Simulation Program (WASP)
The Water Quality Analysis Simulation Program (WASP) is a water quality model developed by the EPA to simulate surface water quality in (1-D), two (2-D), and three (3-D) dimensions.25 The model can simulate and analyze various water quality issues in ponds, streams, lakes, reservoirs, and estuaries. WASP can also be linked with hydrodynamic, watershed, and sediment transport models that provide flows, depths, velocities, temperature, salinity, and sediment fluxes. The limitation of WASP is the massive amount of data required for calibration and its inability to simulate mixing zones essential to dilute pollutants in effluent discharges.21
Overview of Watershed Water Quality Models Used in South Carolina
Watershed water quality models are often used to understand the dynamics of lakes, ponds, and rivers in South Carolina. Lake Marion, for example, is an extensive reservoir of great economic importance in the state. Tufford and McKellar43 used the WASP model to identify, characterize, and explore in-lake mechanisms that influenced primary productivity in the lake. The model developed enhanced the understanding of how ecological factors that influence phytoplankton productivity and nutrient dynamics are different in various parts of the lake.
Lake Greenwood, a major reservoir on the Saluda River, is essential for its high fishery productivity and is threatened by eutrophication due to nutrient loading from upstream activities. McKellar44 developed a database and simulation model of the dynamics of phosphorus loading into Lake Greenwood using the CEQUAL-W2 model. The model was calibrated using updated data for the lake bathymetry, nutrient loading from the two main tributaries (Saluda and Reedy Rivers), and the water quality dynamics within the lake. Taylor and Bulak45 further used HSPF to quantify the contributions of domestic wastewater treatment plants in the Saluda-Reedy watershed to phosphorus loads delivered to Lake Greenwood and predict the impact of reducing the point source loads.
In 2010, the South Carolina Pollution Control Act amended the DO standard in the state. This triggered the application of EFDC to obtain the DO TMDLs in the Cooper River, the Wando River, the Charleston Harbor, and the Ashley Rivers.46 The revised TMDL allows additional loading compared to the previous TMDLs due in part to the model’s accuracy.
Changing water quality regulations and continuing development of Greenville County triggered the assessment of water quantity and quality impacts within the Reedy River watershed by Privette et al.47, using WASP and LSPC models. The modeling result provides a better understanding of the impacts of BMPs and infrastructural development on water quality in the studied watershed. Wastewater treatment plants are essential for treating residential, commercial, and industrial wastewater. Privette and Smink48 explored the impact of wastewater treatment facilities in Greenville city on downstream water bodies such as Boyd Millpond and Lake Greenwood. This study used LSPC for simulating nutrient loading and WASP for water quality modeling, which allows the evaluation of effluent treatment’s impact on total phosphorus and total nitrogen in the receiving water bodies.
Conclusion
Increased population and the quest for better living conditions by humans are directly and indirectly threatening water quality and quantity, which necessitates strategic planning of management actions to enable water security. Watersheds are fundamental units to initiate management plans because of their distinct features and ease of delineation from one to another. Watershed models enhance our understanding of watershed processes and their impacts on hydrology and the quality of water bodies. Management actions to improve water quality can be achieved by applying watershed water quality models as decision support tools. Models vary in complexity and data requirements, and the choice of models is often based on the user’s objectives and sometimes proficiency with a type of model. While watershed water quality models are good for understanding watershed processes and in-stream processes affecting water quality, a common limitation to their use is their intensive data requirement and uncertainty in calibrating the many model parameters. But these limitations can be overcome with model updates and quantification of model uncertainties for proper consideration during decision-making.
Table 1. Features of commonly applied watershed water quality models.
| Models | Organization | File Download URL | Relevant Literature | Features | Model Capabilities |
|---|---|---|---|---|---|
| AQUATOX | United States Environmental Protection Agency (USEPA) | Aquatox 3.2 Download | Anyadike et al.26
Park et al.27 Rashleigh28 |
Simulate the impact and fate of nutrients, sediments, and organic chemicals in aquatic ecosystems. Well-suited for analyzing biomass and chemical transfer among different ecosystems. | Nutrients, sediment, organic waste, toxic substances, phytoplankton, and macrophytes. |
| CE-QUAL W2 | United States Army Corps of Engineers Waterways Experiment Station | CE-QUAL-W2 Model Description | Smith and Kiesling15
Buccola et al.29 Sullivan et al.30 |
Suited for long and narrow waterbodies with vertically varying water quality. | Sediment diagenesis, particle transport, eutrophication (nutrients, multiple algae, periphyton), macrophytes, suspended solids, zooplankton, pH BOD, E. coli, |
| EFDC | USEPA (Originally developed by Virginia Institute ofMarine Science | Environment Fluid Dynamics Code (EFDC) Website. | Zhang and You16
Anagnostou et al.31 |
Uses a wind-wave sub-model that allows for varying wind actions to be incorporated when simulating hydrodynamics and sediment transport. | Hydrodynamic process, temperature stratification, sediment transport, pollutant load estimation, algae and physicochemical water quality parameters. |
| HAWQS | United States Environmental Protection Agency | HAWQS Assessment Tool | HAWQS17
Fant et al.32 Corona et al.33 |
Interactive web-based modeling system.
Simulates at small spatial scales called hydrologic response units (HRU). |
Sediment, DO, pathogens, pesticides, nutrients, water temperature, BOD. |
| HSPF | United States Environmental Protection Agency | BASINS Download Website | Duda et al.20
Shenk et al.34 Li et al.35 |
Simulate hydrology and impact of pollutant loadings from various land cover on receiving natural or artificial water bodies at sub-hourly timesteps. | Temperature, fecal coliforms, DO, BOD, total suspended solids, nitrates, orthophosphates, and pH |
| LSPC | United States Environmental Protection Agency | BASINS Download Website | Sharma et al.19
Yuan et al.20 |
Simulates nutrient loadings that can be coupled with other instream water quality characteristics. | Surface runoff, sediment, nutrients, metals, DO, BOD, plankton. |
| QUAL2K | United States Environmental Protection Agency | QUAL2K Website | Gao and Li22
Yang and Yu36 Kamal et al.37 |
Simulates contaminants in well-mixed lakes and rivers. | Total N, Total P, DO, BOD, sediment oxygen demand, algae, pH, periphyton, pathogen |
| SWAT | United States Department of Agriculture- Agriculture Research Service (USDA-ARS) | SWAT Tool Website | Costa et al.5
Yang and Zhang23 Tan et al.38 Wang et al.39 |
Simulation with daily and sub-daily time steps.
Simulates using small spatial scales. Proficient for simulation of BMP effects on waterbodies. |
Sediment, dissolved oxygen (DO), pathogens, pesticides,
nutrients, water temperature, biological oxygen demand (BOD). |
| WASP | USEPA | WASP Program Website | Ambrose and Wool40
Wool et al.41 Gordillo et al.42 |
Simulating 1D, 2D, and 3D water quality of rivers, lakes, estuaries, and streams. Can also be linked with other watershed models to obtain nutrient loadings. | Nitrogen, Phosphorus, DO, BOD, sediment, algae, periphyton, organic chemicals, metals, mercury, pathogens, temperature. |
References Cited
- He C, James LA. Watershed science: Linking hydrological science with sustainable management of river basins. Science China Earth Sciences. 2021;64(5):677–690. doi:10.1007/s11430-020-9723-4.
- Federal guidelines, requirements, and procedures for the national watershed boundary dataset: U.S. Geological survey techniques and methods. Reston (VA): U.S. Geological Survey and U.S. Department of Agriculture, Natural Resources Conservation Service; 2009. 11–A3, 55 p
- Singh VP, Woolhiser DA. Mathematical modeling of watershed hydrology. Perspectives in Civil Engineering: Commemorating the 150th Anniversary of the American Society of Civil Engineers. 2003;7(4):345–367. doi:10.1061/(asce)1084-0699(2002)7:4(270).
- Borah DK, Ahmadisharaf E, Padmanabhan G, Imen S, Mohamoud YM. Watershed models for development and implementation of total maximum daily loads. Journal of Hydrologic Engineering. 2019;24(1):03118001. doi:10.1061/(asce)he.1943-5584.0001724.
- Costa CM da SB, Leite IR, Almeida AK, de Almeida IK. Choosing an appropriate water quality model – a review. Environmental Monitoring and Assessment. 2021;193(1). doi:10.1007/s10661-020-08786-1.
- Xu F, Dong G, Wang Q, Liu L, Yu W, Men C, Liu R. Impacts of DEM uncertainties on critical source areas identification for non-point source pollution control based on SWAT model. Journal of Hydrology. 2016;540:355–367. https://www.sciencedirect.com/science/article/pii/S0022169416303705.
- Devia GK, Ganasri BP, Dwarakish GS. A review on hydrological models. Aquatic Procedia. 2015;4(Icwrcoe):1001–1007. doi:10.1016/j.aqpro.2015.02.126.
- Deckers D. Predicting discharge at ungauged catchments: parameter estimation through the method of regionalization [master’s thesis]. Enschede (NL): University of Twente; 2006. https://essay.utwente.nl/57578/1/scriptie_Deckers.pdf.
- Islam Z. Literature review on physically based hydrological modeling [PhD thesis]. Edmonton, Canada: University of Alberta; 2011. p. 1–45. https://www.researchgate.net/publication/272169378_A_Review_on_Physically_Based_Hydrologic_Modeling%0A. doi:10.13140/2.1.4544.5924.
- Giri S, Qiu Z. Understanding the relationship of land uses and water quality in the twenty-first century: a review. Journal of Environmental Management. 2016;173:41–48. doi:10.1016/j.jenvman.2016.02.029.
- St-Hilaire A, Duchesne S, Rousseau AN. Floods and water quality in Canada: a review of the interactions with urbanization, agriculture and forestry. Canadian Water Resources Journal. 2016;41(1–2):273–287. Doi:10.1080/07011784.2015.1010181.
- US EPA. Protecting water quality from urban runoff. Washington (DC): United States Environmental Protection Agency; 2003. EPA-841-F-03-003. https://www3.epa.gov/npdes/pubs/nps_urban-facts_final.pdf.
- Ejigu MT. Overview of water quality modeling. Cogent Engineering. 2021;8(1). doi:10.1080/23311916.2021.1891711.
- Olowe KO, Kumarasamy M vellaisamy. Assessment of some existing water quality models. Nature Environment and Pollution Technology. 2018;17(3):939–948.
- Smith EA, Kiesling RL. Updates to the Madison Lake (Minnesota) CE–QUAL–W2 water-quality model for assessing algal community dynamics. Reston (VA) US Geological Survey; 2019. http://pubs.er.usgs.gov/publication/sir20195124. doi:10.3133/sir20195124.
- Zhang CX, You XY. Application of EFDC model to grading the eutrophic state of reservoir: case study in Tianjin Erwangzhuang reservoir, China. Engineering Applications of Computational Fluid Mechanics. 2017;11(1):111–126. doi:10.1080/19942060.2016.1249411.
- HAWQS. HAWQS System and data to model the lower 48 conterminous U.S using the SWAT model. Austin(TX): Texas Digital Library, Texas Data Repository; 2020. doi:10.18738/T8/XN3TE0.
- Duda PB, Hummel PR, Donigian Jr. AS, Imhoff JC, BASINS/HSPF: model use, calibration, and validation. Transactions of the ASABE. 2012;55(4):1523–1547. doi:10.13031/2013.42261.
- Sharma S, Srivastava P, Fang X, Kalin L. Performance comparison of adoptive neuro fuzzy inference system (ANFIS) with loading simulation program C++ (LSPC) model for streamflow simulation in El Niño Southern Oscillation (ENSO)-affected watershed. Expert Systems with Applications. 2015;42(4):2213–2223. https://www.sciencedirect.com/science/article/pii/S0957417414006241. doi:10.1016/j.eswa.2014.09.062.
- Yuan L, Sinshaw T, Forshay KJ. Review of watershed-scale water quality and non-point source pollution models. Geosciences (Switzerland). 2020;10(1):1–33. doi:10.3390/geosciences10010025.
- Kannel PR, Kanel SR, Lee S, Lee YS, Gan TY. A review of public domain water quality models for simulating dissolved oxygen in rivers and streams. Environmental Modeling and Assessment. 2011;16(2):183–204. doi:10.1007/s10666-010-9235-1.
- Gao L, Li D. A review of hydrological/water-quality models. Frontiers of Agricultural Science and Engineering. 2014;1(4):267–276. doi:10.15302/J-FASE-2014041.
- Yang Q, Zhang X. Improving SWAT for simulating water and carbon fluxes of forest ecosystems. Science of the Total Environment. 2016;569–570:1478–1488. https://www.sciencedirect.com/science/article/pii/S0048969716314279. doi:https://doi.org/10.1016/j.scitotenv.2016.06.238.
- Qi J, Li S, Li Q, Xing Z, Bourque CP-A, Meng F-R. A new soil-temperature module for SWAT application in regions with seasonal snow cover. Journal of Hydrology. 2016;538:863–877. https://www.sciencedirect.com/science/article/pii/S0022169416302633.
- Yang C-P, Kuo J-T, Lung W-S, Lai J-S, Wu J-T. Water quality and ecosystem modeling of tidal wetlands. Journal of Environmental Engineering. 2007;133(7):711–721. doi:10.1061/(asce)0733-9372(2007)133:7(711).
- Anyadike CC, Mbajiorgu CC, Ajah GN. Prediction of the physico-chemical interactions of Vimtim Stream water quality using the Aquatox model. IOSR Journal of Engineering. 2013;3(10):01–06. doi:10.9790/3021-031050106.
- Park RA, Clough JS, Wellman MC. AQUATOX: Modeling environmental fate and ecological effects in aquatic ecosystems. Ecological Modelling. 2008;213(1):1–15. doi:10.1016/j.ecolmodel.2008.01.015.
- Rashleigh B. Application of AQUATOX, a process-based model for ecological assessment, to Contentnea Creek in North Carolina. Journal of Freshwater Ecology. 2003;18(4):515–522. doi:10.1080/02705060.2003.9663992.
- Buccola NL, Risley JC, Rounds SA. Simulating future water temperatures in the North Santiam River, Oregon. Journal of Hydrology. 2016;535:318–330. doi:10.1016/j.jhydrol.2016.01.062.
- Sullivan AB, Rounds SA. Modeling water temperature response to dam operations and water management in Green Peter and Foster Lakes and the South Santiam River, Oregon. Reston (VA): US Geological Survey; 2021. http://pubs.er.usgs.gov/publication/sir20205145. doi:10.3133/sir20205145.
- Anagnostou E, Gianni A, Zacharias I. Ecological modeling and eutrophication – a review. Natural Resource Modeling. 2017;30(3):1–27. doi:10.1111/nrm.12130.
- Fant C, Srinivasan R, Boehlert B, Rennels L, Chapra SC, Strzepek KM, Corona J, Allen A, Martinich J. Climate change impacts on US water quality using two models: HAWQS and US basins. Water. 2017;9(2). doi:10.3390/w9020118.
- Corona J, Doley T, Griffiths C, Massey M, Moore C, Muela S, Rashleigh B, Wheeler W, Whitlock SD, Hewitt J. An integrated assessment model for valuing water quality changes in the U.S. land economics. 2020;96(4):478–492. doi:10.3368/wple.96.4.478.
- Shenk GW, Wu J, Linker LC. Enhanced HSPF model structure for Chesapeake Bay Watershed simulation. Journal of Environmental Engineering. 2012;138(9):949–957. doi:10.1061/(ASCE)EE.1943-7870.0000555.
- Li Z, Luo C, Jiang K, Wan R, Li H. Comprehensive performance evaluation for hydrological and nutrients simulation using the hydrological simulation program – Fortran in a mesoscale monsoon watershed, China. International Journal of Environmental Research and Public Health. 2017;14(12). doi:10.3390/ijerph14121599.
- Yang L, Yu X. A review of development and application on river comprehensive water quality model QUAL2K. IOP Conference Series: Earth and Environmental Science. 2018;189(2). doi:10.1088/1755-1315/189/2/022034.
- Ahmad Kamal N, Muhammad NS, Abdullah J. Scenario-based pollution discharge simulations and mapping using integrated QUAL2K-GIS. Environmental Pollution. 2020;259:113909. doi:10.1016/j.envpol.2020.113909.
- Tan ML, Gassman PW, Yang X, Haywood J. A review of SWAT applications, performance and future needs for simulation of hydro-climatic extremes. Advances in Water Resources. 2020;143:103662. doi:10.1016/j.advwatres.2020.103662.
- Wang Y, Jiang R, Xie J, Zhao Y, Yan D, Yang S. Soil and water assessment tool (SWAT) model: a systemic review. Journal of Coastal Research. 2019;93(sp1):22–30. doi:10.2112/SI93-004.1.
- Ambrose RB, Wool T. WASP8 stream transport – model theory and user’s guide. Washington (DC): US Environmental Protection Agency; 2017. 76 p. https://www.epa.gov/sites/production/files/2018-05/documents/stream-transport-user-guide.pdf.
- Wool T, Ambrose RBJ, Martin JL, Comer A. WASP 8: The next generation in the 50-year evolution of EPA’s water quality model. Water. 2020;12(5):1398. doi:10.3390/w12051398.
- Gordillo G, Morales-Hernández M, García-Navarro P. Finite volume model for the simulation of 1D unsteady river flow and water quality based on the WASP. Journal of Hydroinformatics. 2019;22(2):327–345. doi:10.2166/hydro.2019.080.
- Tufford DL, McKellar HN. Spatial and temporal hydrodynamic and water quality modeling analysis of a large reservoir on the South Carolina (USA) coastal plain. Ecological Modelling. 1999;114(2):137–173. doi:10.1016/S0304-3800(98)00122-7.
- McKellar H, Bulak J, Taylor B. A dynamic water quality model of Lake Greenwood, SC. Eastover (SC): SC Department of Natural Resources; 2008. https://www.dnr.sc.gov/fish/fwfi/files/LakeGreenwoodmodelreportMcKellar.pdf.
- Taylor B, Bulak J. Assessing effects of watershed change on phosphorus loading to supplement: impact of point sources on phosphorus loading to Lake Greenwood, South Carolina. Eastover (SC): SC Department of Natural Resources; 2009.
- Cantrell W. Total maximum daily load revision: Charleston Harbor, Cooper, Ashley, and Wando River. Bureau of Water Technical Document Number 0506-13. 2013.
- Privette CV, Taylor SW, Hayes JC, Hallo LS, Nix HB. Forecasting the impacts of future development on water quantity and quality within the Reedy River Watershed. Land Use Policy. 2015;44:1–9. doi:10.1016/j.landusepol.2014.11.016.
- Privette CV, Smink J. Assessing the potential impacts of WWTP effluent reductions within the Reedy River watershed. Ecological Engineering. 2017;98:11–16. doi:10.1016/j.ecoleng.2016.10.058.