This publication introduces different types of flooding and discusses major historical hurricanes and flooding events that have caused significant damage and fatalities in South Carolina. The content of this article is suitable for state stakeholders and officials seeking to gain insights and knowledge to mitigate flooding impacts and consequences.
South Carolina is located in the southeastern portion of the United States with two major regions, the Piedmont Plateau to the west and the Coastal Plain to the east. Additionally, the northwest corner of the state includes the Blue Ridge, which covers portions of Upstate counties including Oconee, Pickens, Greenville, and Spartanburg. South Carolina enjoys a humid subtropical climate with hot summers and mild winters. The state has eight major river basins, including the Broad, Catawba, Edisto, Pee Dee, Salkehatchie, Saluda, Santee, and Savannah (figure 1), extending into neighboring states Georgia, North Carolina, and Virginia. Like many other states in the southern and southeastern United States, South Carolina is prone to catastrophic floods.1 Flooded roads and homes have become a familiar sight in many parts of the state, particularly in coastal regions. Data shows that these flood events are happening much more frequently and will likely intensify in the future.2 Flooding could occur more frequently and more intensely for homes in a flood zone. Additionally, areas that previously did not experience flooding now have an increased threat of flood damage.
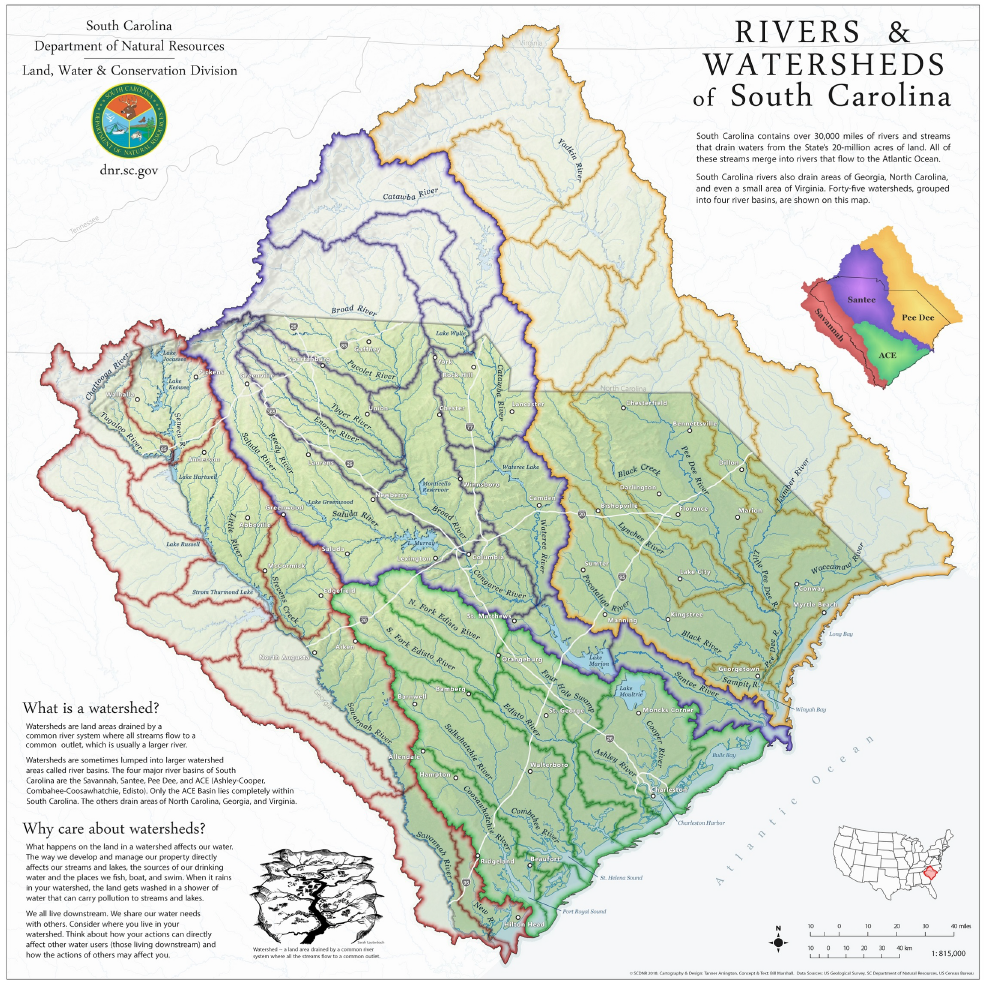
Figure 1. South Carolina’s eight major river basins that extend into neighboring states of Georgia, North Carolina, and Virginia. Image credit: SC Department of Natural Resources (SCDNR).
What is a Flood?
A flood is an overflow of water that submerges land that is usually dry. There are four different types of floods, including (1) coastal flooding, (2) flash flooding, (3) fluvial flooding, and (4) pluvial flooding.3 Each type of flood is discussed briefly below.
1. Coastal Flooding
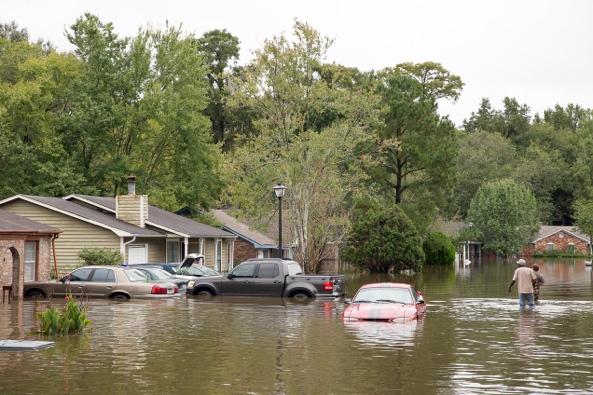
Figure 2. Coastal flooding in Charleston in the aftermath of Hurricane Joaquin in 2015. Image credit: “Flooding in North Charleston” by Ryan Johnson is licensed under CC BY-SA 2.0.
Coastal flooding usually occurs when low-lying areas are submerged by seawater. In addition to storm-induced flooding, sea level rise progressively increases the frequency and severity of coastal flooding. Coastal communities in South Carolina are increasingly at risk of coastal flooding on days with less extreme tides or little wind, even on sunny days. Today, South Carolina has 229,000 people at risk of coastal flooding, and an additional 56,000 people are projected to be at risk due to sea level rise by 2050.4 Figure 2 shows coastal flooding in Charleston in the aftermath of Hurricane Joaquin in 2015.
2. Flash Flooding
Figure 3. Flash flooding on July 29, 2004, in the Reedy River Watershed in Greenville, South Carolina. Image credit: National Weather Service (NWS).
Flash flooding is a specific type of flooding caused by heavy or excessive rainfall that generates rapid runoff in a short period of time, generally less than six hours. Flash floods are often the result of heavy rains associated with severe thunderstorms or convective summer storms. The construction of buildings, highways, driveways, and parking lots increases flash flood risk by reducing water infiltration. Often urban streams are routed underground into storm drains. During flash flood events, storm drains can become plugged by debris, resulting in the drains malfunctioning and flooding the nearby roads and buildings. Many parts of the state are vulnerable to flash floods, particularly low-lying areas. Figure 3 shows a flash flood event on July 29, 2004, in the Reedy River Watershed in Greenville, South Carolina.
3. Fluvial Flooding
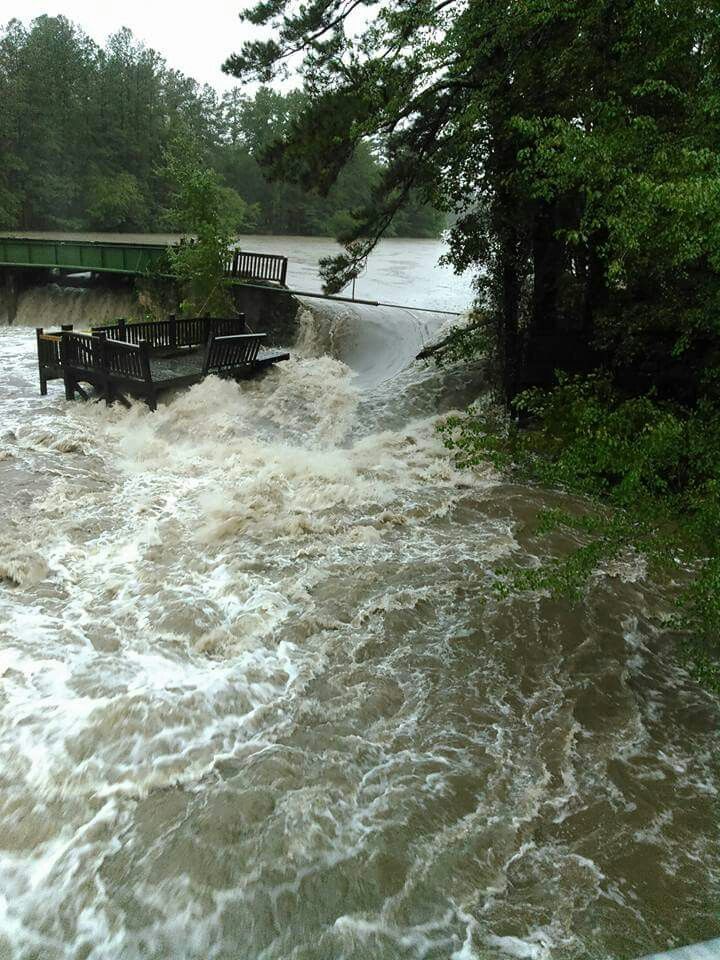
Figure 4. Fluvial flooding on October 14, 2015, in Gibson Pond Park in Lexington, South Carolina. Image credit: National Weather Service (NWS).
Fluvial flood (riverine and inland) is the most common type of flooding that occurs when the water level in a river, lake, or stream rises and overflows onto the floodplain and surrounding areas. The rise of water level could be related to excessive rain or snowmelt, particularly during tropical systems and persistent thunderstorms. To control fluvial flooding, engineers concentrate on the construction of embankments (known as levees) and retention by reservoirs. Sometimes, fluvial flooding can cause the failure of these critical infrastructures that are often built along streams and water bodies to prevent high water from flooding bordering land. Many parts of South Carolina are at risk of fluvial flooding due to aging critical infrastructure in addition to construction in floodplains. Figure 4 shows fluvial flooding on October 4, 2015, in Gibson Pond Park in Lexington, South Carolina.
4. Pluvial Flooding
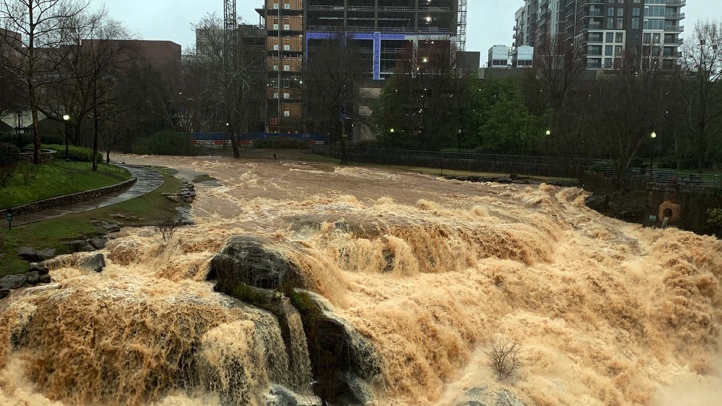
Figure 5. Pluvial flooding rushes over Reedy River Falls in downtown Greenville during a storm on October 3, 2015.
Pluvial or surface water flooding is caused by sustained and heavy rainfall that overflows and cannot be absorbed by the watershed system. Pluvial floods are an increasing problem for urban areas worldwide because the drainage systems overflow, and the excess runoff cannot be absorbed. Urban developments and climate change are stress factors that intensify the issue of pluvial flooding. Increasing the capacity of sewer and drainage systems and improving green infrastructure are ways to control pluvial flooding, although it requires significant investments. Figure 5 shows pluvial flooding in Greenville, South Carolina, in October 2015.
Significant South Carolina Floods
While extraordinary rainfall events caused some flooding, most occurred during hurricane season (June through November). Eight major flooding events in South Carolina are presented as examples in this publication. The associated data and information were collected from various resources including the National Weather Service (NWS), National Hurricane Center (NHC), SC Department of Natural Resources (SCDNR), SC Department of Health and Environmental Control (SCDHEC), SC Emergency Management Division (SCEMD), and US Geological Survey (USGS). Additional information about the examples presented and other hurricanes and major flooding events in South Carolina is available on the SCDNR South Carolina Hurricanes and Tropical Storms website and the NWS Flooding in South Carolina website.
The Great Pacolet Flood of 1903
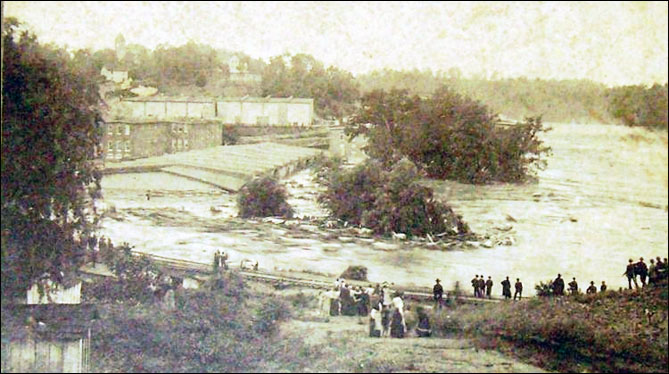
Figure 6. The Pacolet River flooded during the Great Flood of 1903. Image credit: Pacolet Memories, pacoletmemories.com (“The Flood,” Saturday, June 6, 1903, pacoletmemories.com/Album6.pdf).
On June 6, 1903, a great disaster struck the entire Pacolet River valley in South Carolina. The event started as a gentle five-day rain that saturated the ground, and then the floodwaters of the Pacolet River rose 20 ft above normal and destroyed six textile mills in Pacolet and Clifton. At least sixty-five people died, with some accounts as high as eighty, with massive damage to the mills and the community (figure 6). The damage cost was estimated to be $5 million. The inscription on a historical marker in the City of Converse reads, “The flood’s fury destroyed four textile mills and inflicted heavy damage to two others, laid waste to at least seventy-five homes, and wiped-out warehouses filled with cotton bales. Many victims were never found; others were buried where their bodies were discovered, some as far away as Union County. The flood left a 12-mile-long path of devastation strewn with textile machinery, downed trees, flattened houses, washed-out bridges, and the bodies of its victims. More than 4,000 cotton mill employees from Converse to Pacolet were without paychecks for many months.”5
The Record Flood of 1908
In 1908, the flood which occurred during August 23–26 was the most extensive flood of record. Many parts of South Carolina, such as Anderson, received 12 in of rainfall in twenty-four hours.5 All major rivers in the state rose between 9 ft to 22 ft above the flood stage. The heavy rains caused the highest river levels ever to be recorded on the Wateree in Camden and the Congaree in Columbia,6 and caused extensive damage (figure 7). Over 80% of the state was affected by flooding, and five people died in Camden. Spartanburg County was under water due to heavy rain falling for forty-eight hours. The record discharge occurred on August 27, 1908, and was 364,000 ft3/s. The river crested at 39.8 ft.5 The 1908 flood was reported in the Monthly Weather Review (figure 8).
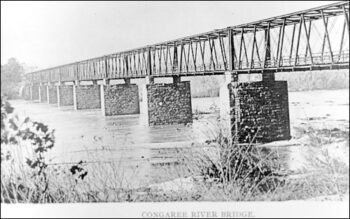
Figure 7. Congaree River Bridge flooded during the record flood of 1908. Image credit: The Walker Local and Family History Center, Richland County Library Archives.
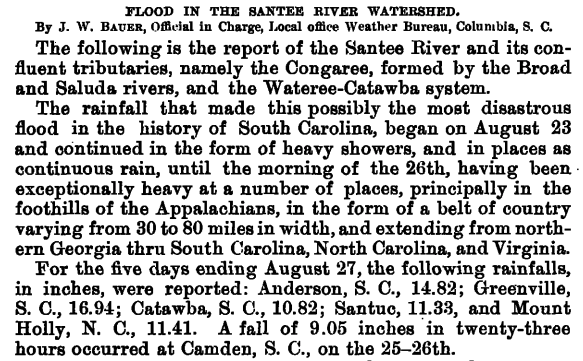
Figure 8. Excerpt from the August 1908 Monthly Weather Review. Image credit: J.W. Bauer, Flood in the Santee River Watershed, Monthly Weather Review. August 1908, Volume 36, Issue 8. bit.ly/3WsgsuB.
The Southeast Hurricane
The Southeast Hurricane of 1940 (figure 9) approached the state near Beaufort, South Carolina, on August 11, 1940, with winds of 105 mph. Flooding occurred across the state from August 11–19. Rainfall totals between 7 in to 12 in were recorded in the southern and northwestern sections of the state.7 The largest 24-hour rainfall total was 10.84 in recorded near Beaufort. The extreme high tide at Charleston was 10.71 ft above the mean low water. The number of those killed is still in dispute, but between thirty and fifty people lost their lives due to the storm surge and flooding. Crop losses, including corn, hay, and cotton, were severe in the coastal sections, and trees and roofs were damaged fifty miles inland.8 Property and crop damage were estimated to be $10 million.“The flooding was the greatest on record at that time for the North Pacolet River at Fingerville. The recurrence intervals at this site and on the Broad River near Carlisle were greater than one hundred years.”7
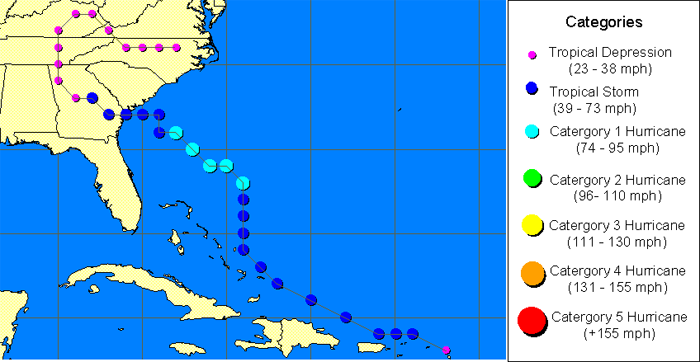
Figure 9. Track of Southeast Hurricane of 1940. Image credit: SC State Climatology Office.
Hurricane Hugo
Hurricane Hugo (figure 10) was one of the strongest hurricanes in South Carolina’s history that made landfall as a Category 4 storm near Sullivan’s Island at midnight on September 21, 1989.9 The hurricane caused thirteen directly related deaths, twenty-two indirectly related deaths, and injured several hundred people in South Carolina. Damage within the state from Hurricane Hugo has exceeded $7 billion, including $2 billion in crop damage.10 Hurricane Hugo’s maximum sustained winds were 138 mph, with over 10 in of rain in some parts of South Carolina, including Edisto Island. Hurricane Hugo produced tremendous storm surge damage (figure 11) “along the coast as well as significant wind damage well inland with hurricane-force wind gusts into western North Carolina.”9
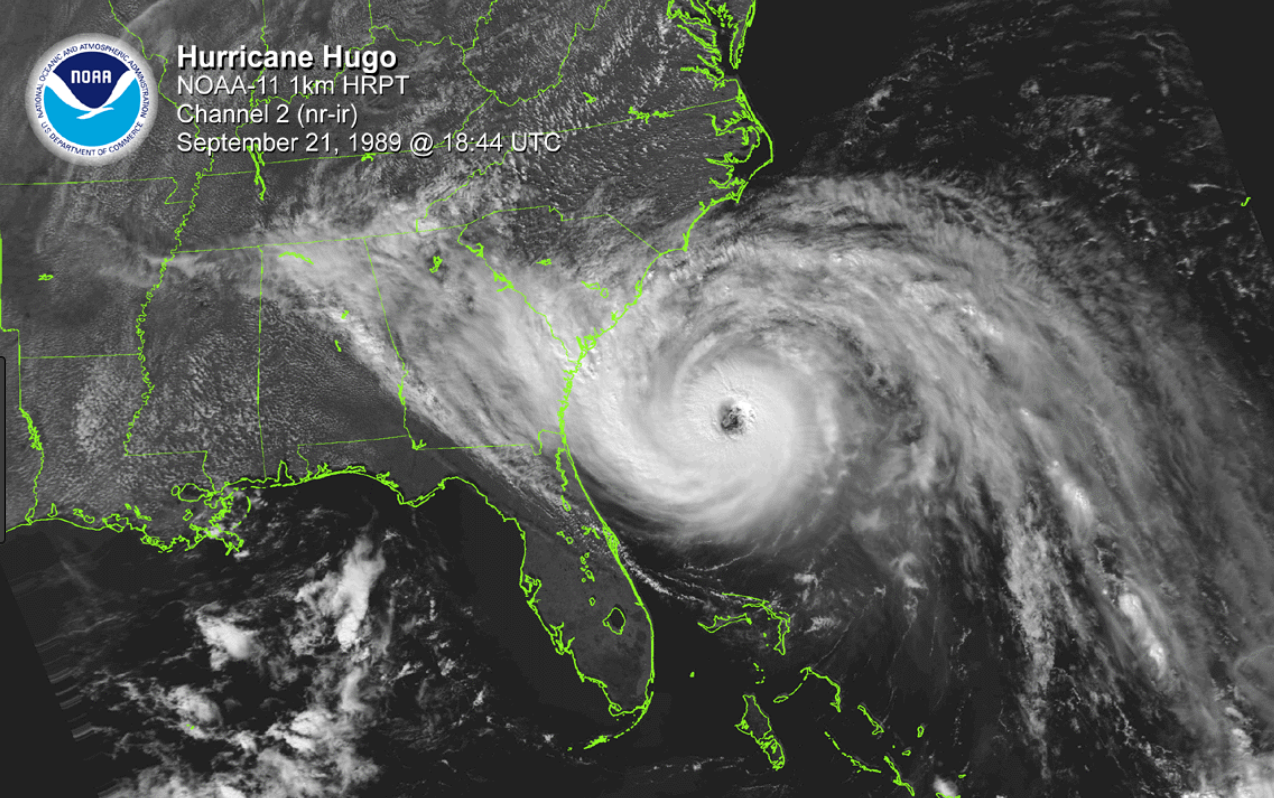
Figure 10. Hurricane Hugo September 21, 1989. Image credit: National Weather Service (NWS).
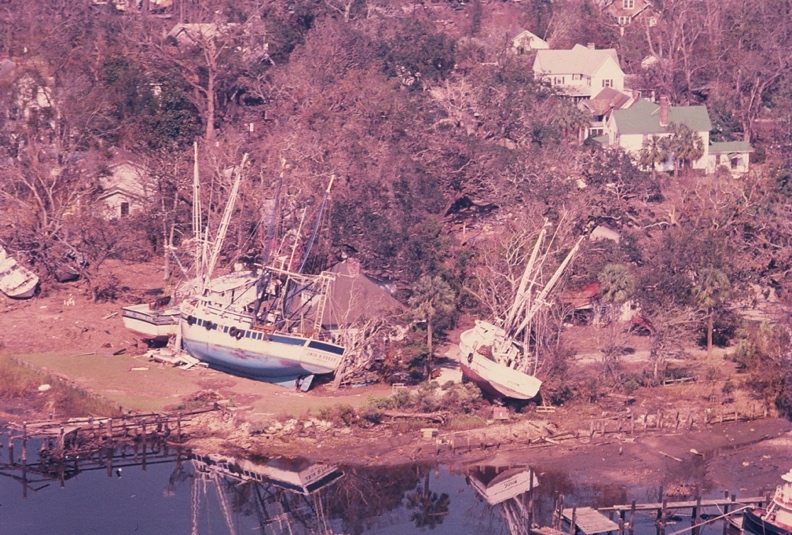
Figure 11. Storm surge damage from Hurricane Hugo. Image credit: “Hurricane Hugo,” the SC National Guard.
Tropical Depression Klaus and Tropical Storm Marco
A joint occurrence of tropical depression Klaus and tropical storm Marco brought extensive flooding to South Carolina during October 10–13 and October 22, 1990 (figure 12). The rainfall reached between 10 in to15 in across portions of South Carolina during Hurricane Klaus, while much of the state received over 7 in of rain from tropical storm Marco. This combined event killed five people and washed out more than 120 bridges on secondary road systems.6 Seventeen earthen dams failed, and thirty-one were damaged from overtopping.11 The government declared thirteen counties federal disaster areas. “The total damage to property and crops was around $12 million.”3 Based on National Weather Service (NWS) reports, rainfall totals were excessive, including one unofficial report of nearly 17 in in the town of Rembert, the highest recorded in one hundred years in this area.3
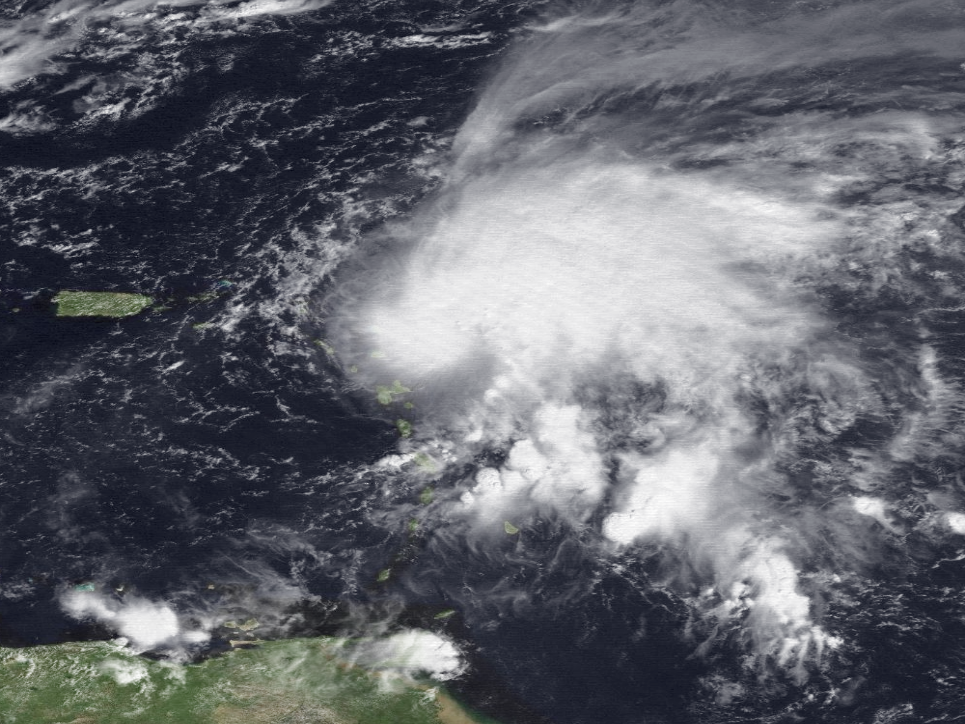
Figure 12. Hurricane Klaus at peak intensity over the Leeward Islands on October 5. Image credit: National Weather Service (NWS).
Hurricane Joaquin
The 2015 historic rains caused by Hurricane Joaquin on October 1–5 “led to historic rainfall with widespread amounts of 15 to 20 in and localized amounts over 25 in, mainly in the Charleston Tri-County Area (figure 13).”11 The flood peak of many USGS gauges, including those located in the center of South Carolina, was almost twice the previous maximum from a record of over the previous sixty-five years.12 The spatial extent of flooding in this portion was also unprecedented, with more record flood peaks at USGS stream gauging stations in urban areas such as Columbia, South Carolina, than for any other rural catchments. Flash flooding was prevalent and significantly damaged numerous properties, roads, and critical infrastructure. The heavy rainfall and runoff, combined with aging and inadequate drainage infrastructure, resulted in the failure of fifty state-regulated dams, two federally owned dams (overall emergency orders on seventy-five dams) and flooding of many bridges and conveyance facilities, causing perilous and life-threatening situations.5,9 The SCDHEC issued emergency orders to dam owners and operators after dozens of dams throughout South Carolina breached or were weakened by floodwaters following the floods of October 2015, including forty-nine dams in the Midlands region. Some emergency orders are classified as C-1, meaning “failure may cause loss of life or serious damage to infrastructure.” Hurricane Joaquin’s damage estimated economic cost was $12 billion.
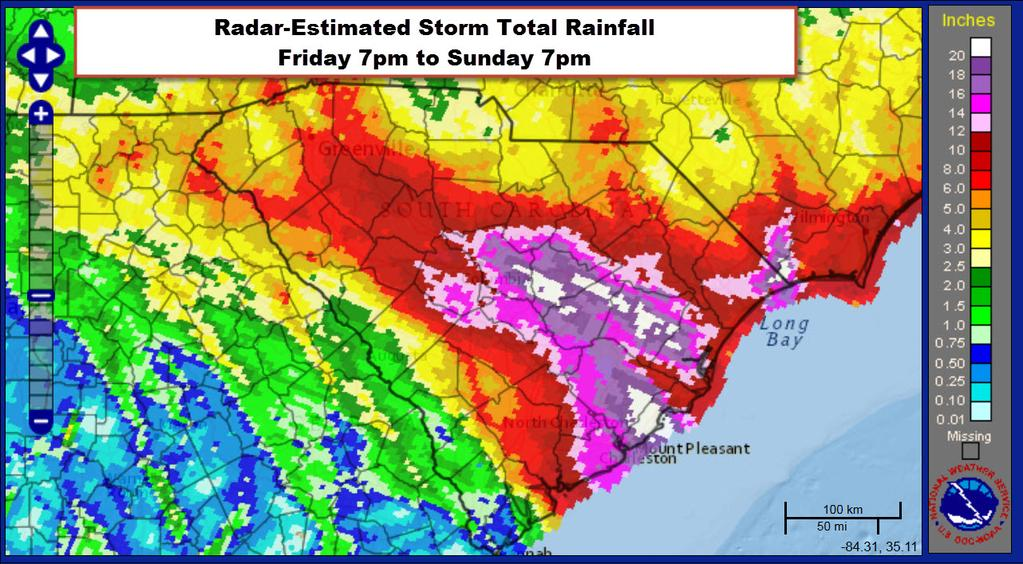
Figure 13. Rainfall Totals through the evening of October 4th, 2015, with Hurricane Joaquin. Image credit: National Weather Service (NWS).
Hurricane Matthew
Late in the morning of October 8, Hurricane Matthew, the most powerful storm of the 2016 Atlantic Hurricane Season, made landfall near McClellanville, South Carolina as a Category 1 hurricane (figure 14). Between 12 in to 18 in of rain fell over large portions of South Carolina and North Carolina. According to the NHC, Matthew was directly responsible for twenty-five deaths in North Carolina and four in South Carolina, all but one due to flooding.5 “In most locations, water levels were between 3 ft to 5 ft above the normal astronomical tides, which resulted in the failure of twenty state-regulated dams.”11 In Beaufort and Charleston counties, Hurricane Matthew’s damage was severe due to storm surge flooding. The damage cost associated with Hurricane Matthew was estimated to be $550 million, with $100 million in damage to public roads and $52 million in insured crop damage.5
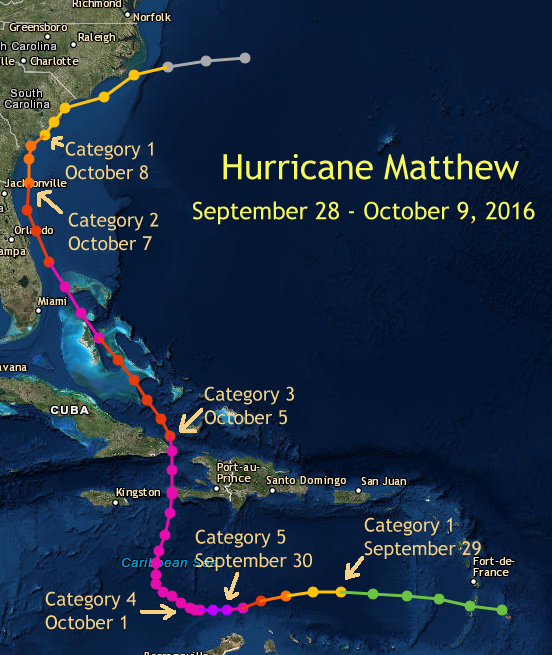
Figure 14. Hurricane Matthew’s track across the Caribbean and along the southeastern US coast September 28–October 9, 2016. Image credit: National Weather Service (NWS).
Hurricane Florence
Hurricane Florence, a large and slow-moving Category 1 hurricane, made landfall on the morning of September 14, 2018. Over 30 in of rain was measured in several locations in North Carolina, far exceeding the highest single-storm rainfall amounts ever fallen in this area. In Loris, South Carolina, 23.63 in of rain was recorded, setting a new state tropical cyclone rainfall record (figure 15). Torrential rain from Hurricane Florence fell for days, causing historic flooding across portions of eastern South Carolina. At the east end of Nichols, South Carolina, the Little Pee Dee River rose by 17 ft during Matthew. The majority of the damage caused by Hurricane Florence was due to the rainfall inland, which caused many rivers to surpass previous record flood heights.13 The SCEMD “reported nine fatalities across the state, $607 million damage, 11,386 homes with moderate or major damage, 455,000 people evacuated,” and eleven dams breached or failed. Agriculture was widely affected (> $80M)14 in eight Pee Dee counties, with severe damage in Dillon, Marlboro, and Marion Counties.
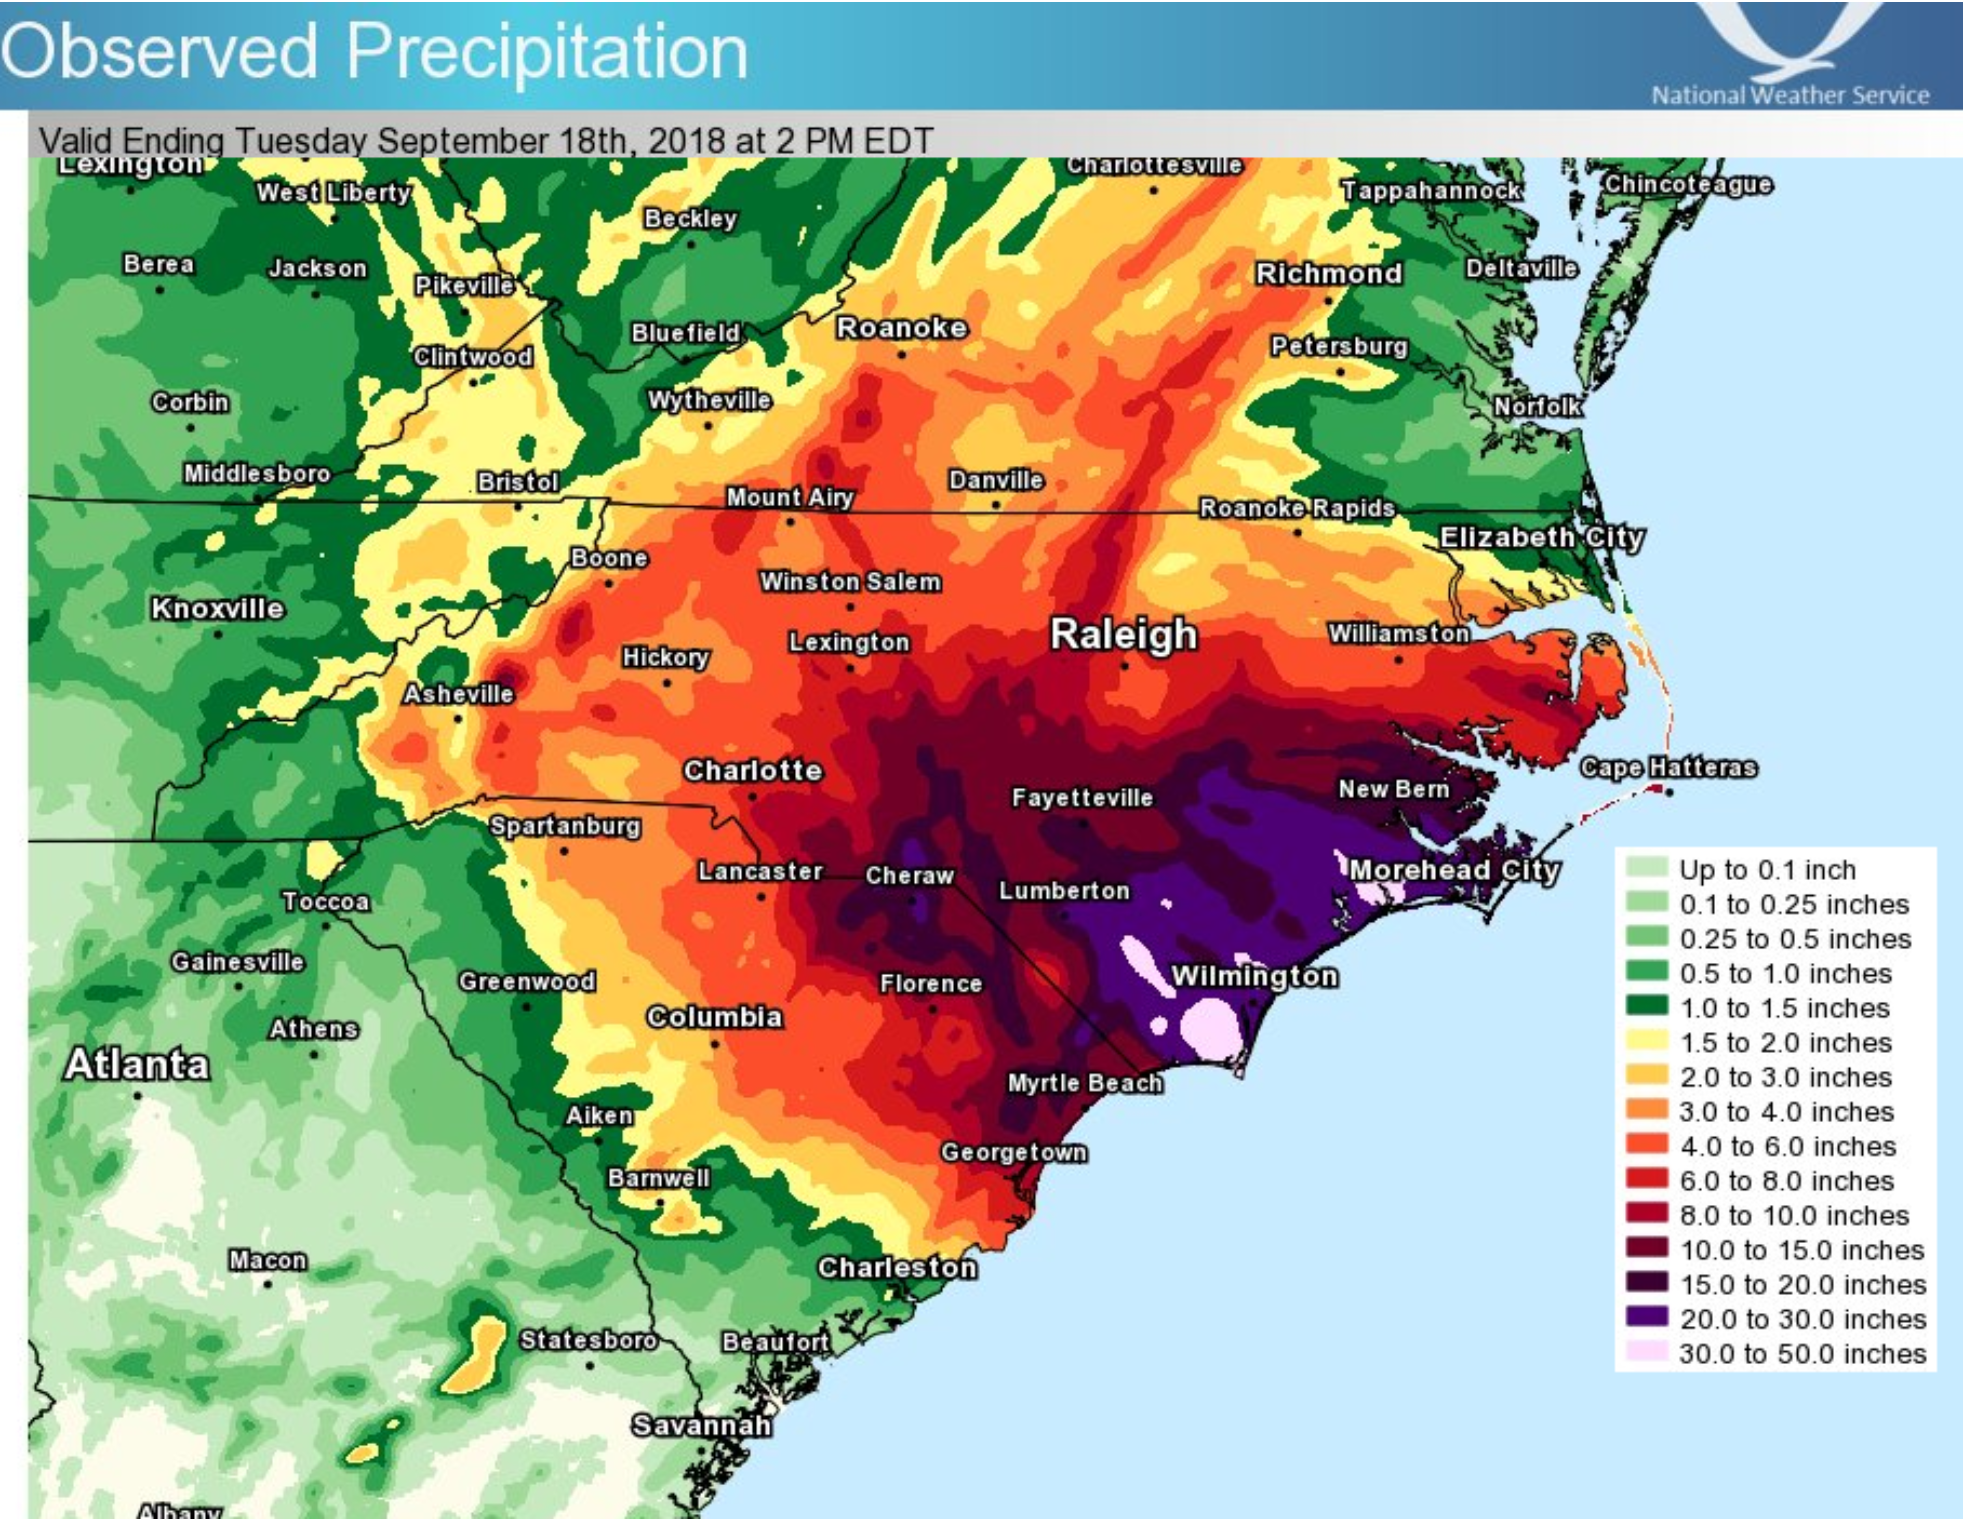
Figure 15. Multi-sensor rainfall estimates from Hurricane Florence, produced by NWS Eastern Region Headquarters. Image credit: National Weather Service (NWS).
Conclusion
This publication summarized eight of South Carolina’s significant flooding events, and potential damage costs and rainfall amount data are compiled in table 1. Tremendous damage can happen to critical infrastructure, agriculture, coastal cities, and towns when a flood occurs. Floods that block roads can cut off access to utilities and emergency services and affect transportation. A weak, slow-moving storm can cause more damage due to flooding than a more powerful, fast-moving hurricane. This was very evident with Hurricane Florence in 2018.
In the aftermath of floods, community decision-makers and citizens are looking to research sources to help them plan for future hazards. Even though there is much work to be done preparing communities for weather-related hazards, there are many inspiring cases of resilience and mitigation planning that can be implemented as models for South Carolina. Nature solutions—such as designing flood storage ponds, leaky woody dams, and replacing impervious surfaces with green infrastructures—are important measures and strategies to consider for addressing flood risk. Nature-based solutions can decrease and/or delay floodwater peaks and volumes using natural processes and increase the lead time to give more time for emergency response. The Dutch Dialogues™ Charleston15 is an example of a report which details the benefits of nature-based solutions and planning and resilience for coastal communities.
Such solutions can improve not only flood risk but also combat climate change, improve water quality, restore and protect wetlands, stabilize shorelines, and reduce urban heat island effects.3 The use of these solutions in an area where nature is one of its main attractions, such as South Carolina, is imperative. It is critical stakeholders take up these solutions to ensure that communities in South Carolina—and the roads, bridges, and other essential infrastructure they depend on daily—are flood-ready.
Table 1. Summary of SC historical floods. The data was collected from various resources such as SCEMD, SCDNR, and NWS.
| Flood Event | Date | Rainfall Amount (total in inches) | Damage (USD) |
|---|---|---|---|
| The Great Pacolet Flood | June 6, 1903 | 11 | $5M (1903 USD) |
| The Record Flood of 1908 | August 23–26,1908 | 10.4 | > $3 M (1908 USD) |
| The Southeast Hurricane | August 11, 1940 | 10.8 | $10 M (1940 USD) |
| Hurricane Hugo | September 21, 1989 | > 10 | $7B (1989 USD) |
| Tropical Depression Klaus & Tropical Storm Marco of 1990 | October 10–13 and October 22, 1990 | ~ 17 | $12 M (1990 USD) |
| Hurricane Joaquin | October 1–5, 2015 | > 25 | $12 B (2015 USD) |
| Hurricane Matthew | October 7–8, 2016 | 12–18 | >$650 M (2016 USD) |
| Hurricane Florence | September 14–16, 2018 | > 23 | $607M (2018 USD) |
References Cited
- Burns R. SC floods damage: $12 billion, economists say. The State (Local). 2015 Dec 1. www.thestate.com/news/local/article47471060.html.
- Jiang X, Yang ZL. Projected changes of temperature and precipitation in Texas from downscaled global climate models Climate Research. 2012 Jul;53:(3)229–244.
- NatureNetwork. Nature-based solutions. Brussels (BE): European Commission. 2023 [accessed 2022 Nov 17]. https://networknature.eu/networknature/nature-based-solutions. https://networknature.eu/networknature/nature-based-solutions#:~:text=Nature%2Dbased%20solutions%20are%20defined,benefits%20and%20help%20build%20resilience .
- Surging Seas Risk Finder. South Carolina, USA. Princeton (NJ): Climate Central; 2014 Jul [accessed 2022 Nov 12]. https://riskfinder.climatecentral.org/state/south-carolina.us?comparisonType=county&forecastType=NOAA2017_int_p50&level=5&unit=ft .
- South Carolina State Climatology Office. South Carolina storms of the century. Columbia (SC): South Carolina Department of Natural Resources (SCDNR); [accessed 2022 Feb 3]. https://www.dnr.sc.gov/climate/sco/Publications/storms_of_centry.php#:~:text=1908%20-%20Flood%3A%20The%20flood%20of,Carolina%20causing%20unprecedented%20statewide%20flooding.
- NSSL (NOAA National Severe Storms Laboratory). Severe weather 101—floods: flood types. Norman (OK): National Oceanic and Atmospheric Administration (NOAA); [accessed 2022 May 19]. https://www.nssl.noaa.gov/education/svrwx101/floods/types/.
- Mizzell H, Griffin M, Murray G. SC hurricanes comprehensive summary. Columbia (SC): South Carolina State Climatology Office, South Carolina Department of Natural Resources (SCDNR); 2021 July [updated 2021 Jul; accessed 2022 Feb 3]. https://www.dnr.sc.gov/climate/sco/hurricanes/pdfs/SCHurricanesExecutiveSummary.pdf.
- Weather.gov. Flooding in South Carolina. Silver Spring (MD): National Weather Service (NWS); [accessed 2022 Feb 3]. https://www.weather.gov/safety/flood-states-sc.
- Phillips RC, Samadi SZ, Meadows ME. How extreme was the October 2015 flood in the Carolinas? An assessment of flood frequency analysis and distribution tails. Journal of Hydrology. 2018 Jul; 562:648–663.
- Feaster TD, Shelton JM, Robbins JC. 2015, Preliminary peak stage and streamflow data at selected USGS streamgaging stations for the South Carolina flood of October 2015 (ver. 1.1). Reston (VA): U.S. Geological Survey (USGS); 2015 (updated 2015 Nov; accessed 2022 May 19). Open-File Report 2015–1201. 19 p. doi:10.3133/ofr20151201.
- SC Flood Information. Columbia (SC): SC Department of Health and Environmental Control; 2019 [accessed 2022 Oct 31]. https://scdhec.gov/disaster-preparedness/hurricanes-floods/sc-flood-information.
- Weather.gov. Historic flooding – October 1–5, 2015. Silver Spring (MD): National Weather Service (NWS); [accessed 2022 May 19]. https://www.weather.gov/chs/HistoricFlooding-Oct2015 .
- Events. U.S. Billion-Dollar Weather and Climate Disasters. Washington (DC): National Centers for Environmental Information; 2023 [accessed 2022 Oct 31]. https://www.ncei.noaa.gov/access/billions/events/SC/1980-2022 .
- Weather.gov. Hurricane Hugo. Silver Spring (MD): National Weather Service (NWS); [accessed 2022 March 21]. https://www.weather.gov/ilm/hurricanehugo.
- Morris D, Waggonner D. Dutch Dialogues™ Charleston. New Orleans (LA): Waggonner & Ball, The Water Institute of the Gulf, Kingdome of the Netherlands; 2019 [accessed 2022 Nov 11].
- https://www.charleston-sc.gov/DocumentCenter/View/25055/Dutch-Dialogues-Charleston_Final-Report-September-2019 .