Understanding the economic implications of different land management objectives is critical for private forest landowners. This publication will provide a framework for landowners to estimate the economic tradeoffs, also referred to as opportunity cost, of managing loblolly pine (Pinus taeda) plantations in South Carolina for timber production versus a management regime that incorporates enhancing wildlife habitat in addition to timber production. Additionally, this article will examine potential hunting lease revenue associated with managing a forest property for wildlife benefits and its potential to offset lost timber revenue.
Introduction
Private forest landowners, specifically family forest owners, have multiple objectives for owning and managing their property.1 A survey of family forest owners revealed that hunting, recreation, or aesthetics were more often the reason for property ownership rather than timber production.1 Managing property for various objectives may require different cost inputs and potential timber revenue losses. In South Carolina, loblolly-shortleaf pine account for over 43% of forest types, and loblolly pine is the most common tree species.2,3 We will introduce the basic financial concepts associated with determining the opportunity costs of multiple management objectives.
The Basics of an Economic Analysis
Two concepts used to determine the economic tradeoff between managing forests solely for timber production versus managing for timber and wildlife are net present value (NPV) and equivalent annual income (EAI), assuming various interest rates. We will present these concepts, along with a discussion of interest rates, using them in an example comparing the economic tradeoff between forest management regimes.
Interest Rates
Interest rate is the first consideration when comparing the economic benefits between various management regimes. Two kinds of interest rates need to be considered, the market interest rate and the real discount rate. The market interest rate accounts for the cost of inflation, while a real discount rate does not account for inflation. For example, if an investor wants to actually earn 6% interest rate, then this is the real discount rate. However, assuming there is a 4% inflation rate, the market interest rate would be 10% (6% real discount rate + 4% inflation rate). This means that accounting for inflation, an investment would need to actually earn 10% in order to make 6% since inflation is actually 4% of the investment return.
Net Present Value
Net present value (NPV) is simply how much a sum of money is worth today assuming a specific interest rate over time and is referred to as discounting. Discounting is a way to move “money through time while taking interest into account.”4 The NPV incorporates the time value of money and subtracts total discounted costs from total discounted revenues at a specified interest rate.4 Discounting costs and revenues puts them in terms of present value. Two formulas are used for these calculations, the first for single sum costs or revenues and the second for annual payments.
NPV of a Single Sum: 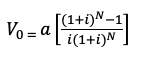
NPV of a Terminating Annual Series:
where:
V0 – Value in year 0, today’s value
Vn – Value in year n
i – interest rate
N – number of years in rotation
a – annual revenue or payment amount
For example, calculating NPV using the Single Sum equation, assume the value of an investment in 35 years (the number of years in a hypothetical rotation) will be $1,000 and an inflation rate of 5%. We substitute the numbers in the formula, and it would look like the following:
When we solve the equation, the solution is:![]()
This means that $1,000 at 5% interest 35 years in the future is equal to $181.29 today.
Once all costs and revenues are in present value, the revenue total minus the cost total gives the net present value for the analysis. A NPV greater than or equal to 0 is a suitable management regime at the designated interest rate.5 This means that the revenues generated are greater than the input costs.
Equivalent Annual Income
Equivalent annual income (EAI) is another criterion to consider for comparing management regimes. EAI is the NPV of a management regime distributed annually over the length of the rotation, which for this example will be 35 years, and is expressed mathematically as:4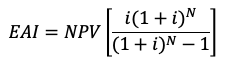
Continuing with the example from above to solve the EAI equation, we substitute as follows: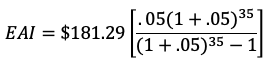
When we solve for the equation, we have:
EAI = $11.07
Therefore, $11.07 is the equivalent of what would be expected for payment on an annual per acre basis at the chosen 5% discount rate. Since this number is above zero, it is considered an acceptable investment since it earns money instead of losing money.
Now that the basic concepts and calculations have been presented, we will provide an example detailing how to evaluate various land management regimes.
Economic Assumptions for Tradeoffs Between Timber Versus Timber and Wildlife Regimes
Forest landowner costs, stumpage prices, and management regimes vary widely across South Carolina based on individual stand conditions. Some of the costs associated with forest land ownership are fixed (e.g., taxes), while others will vary based on land management objectives (e.g., prescribed fire). Income from timber is usually realized either from thinning or final harvest, and current stumpage prices and amount of timber to sell will dictate the income earned. To calculate the difference in revenue between managing for timber only versus timber and wildlife, we present an example analysis based on the following assumptions.
- Stumpage prices: We used average statewide stumpage prices for pine as reported by the South Carolina Forestry Commission between 2015 and 2019 (table 1).6
- Costs of common forestry practices: We used the average costs of common forestry practices across the southeastern United States,7 along with annual management costs (table 2).8 It should be noted from table 2 that the annual management cost is higher when managing for timber and wildlife. A base per acre annual cost was used for this example. We also estimated an annual property tax cost per acre for the forest property.
- Potential costs and revenues: This analysis examines potential costs and revenues of a managed loblolly pine plantation with a site index of 70, base age 25 over a 35-year rotation with two thinnings.
- Initial stand density: We assumed an initial stand density of 544 trees per acre.
- Real interest rate of 5%: Assuming a real interest rate of 5% means that we would expect a 5% return on investment if we invested our money in another option.
Table 1. Average stumpage prices, South Carolina 2015-2019.6
| Product | Stumpage Price per Ton ($) | ||
| Low | Medium | High | |
| Pine Pulpwood (PP) | 10.26 | 11.05 | 12.20 |
| Pine Chip-N-Saw (CNS) | 17.48 | 18.06 | 18.62 |
| Pine Sawtimber (ST) | 23.88 | 25.42 | 26.53 |
Table 2. Example management regimes, costs in dollars per acre.
| Year | Timber Production | Wildlife and Timber | Cost per Acre ($)7 |
| 0 | Mechanical Site Prep | Mechanical Site Prep | 182.28 |
| 0 | Chemical Site Prep | Chemical Site Prep | 79.41 |
| 0 | Seedlings and Planting | Seedlings and Planting | 118.24 |
| 2 | Weed Control | Weed Control | 24.23 |
| 14-32, 3 Year Interval | Prescribed Fire | 28.46 | |
| 17 | Woody Release Treatment | 66.22 | |
| Annual | Management Cost | 6.00 | |
| Annual | Management Cost | 5.00 | |
| Annual | Taxes | Taxes | 2.00 |
The timber production model presented in table 3 includes plantation thinning to 80 ft2/acre basal area, while the wildlife and timber regime thins to a basal area of 60 ft2/acre. Thinning to a lower basal area, complemented by a frequent prescribed fire rotation, allows for more sunlight to reach the forest floor and promotes the growth of understory plant species beneficial to wildlife, but results in overall lower timber production and increased input costs.9 However, it should be noted that the wildlife and timber regime results in high sawtimber yields at final harvest. Timber yield estimates do not incorporate potential gains or losses from stand management treatments, only basal area management.
Table 3. Estimated yields, tons per acre.
| Regime | Thin 1 Tons/Acre | Thin 2 Tons/Acre | Final Harvest Tons/Acre | ||||
| PP | CNS | PP | CNS | PP | CNS | ST | |
| Timber | 26.9 | 2.5 | 29.0 | 15.5 | 6.1 | 70.3 | 46.0 |
| Wildlife and Timber | 40.5 | 2.1 | 21.8 | 15.9 | 1.2 | 37.9 | 56.1 |
We will not include the cost of land in these calculations, assuming the land is already owned. This analysis does not account for inflation over the rotation. To calculate expected income so the NPV can be calculated, it is first necessary to calculate the income based on the expected amount of timber available for harvest and then put it in NPV (or discounting it from the future value to today’s value and calculating the difference between income and expenses). The management plan assumes a thinning at year 15 and 25 and a final harvest at age 35. To calculate the revenue, multiply the amount of available timber for harvest at the specified time period (table 3) by the stumpage prices based on high, medium, or low prices by product class (pine pulpwood, pine chip-n-saw, or sawtimber; table 1). After calculating this revenue, it is then necessary to put this value back in today’s dollars (because it is a value in the future). For example, to calculate the expected revenue for the timber and wildlife management regime assuming low stumpage prices (table 4) is as follows:
Thinning 1: Pine pulpwood = 40.5 tons * $10.26 per ton = $415.53
Pine chip-n-saw = 2.1 tons * $17.48 per ton = $36.71
The total expected revenue from 1st thinning = $452.24, but it must be discounted back to present day value which would be $217.53. When the expected revenue for the 2nd thinning ($501.60; discounted $148.12) and final harvest ($2014.47; discounted $365.20) are calculated and added to the revenue from the 1st thinning, it shows a revenue stream for timber and wildlife assuming a low stumpage price of $730.85, which is the discounted revenue.
Table 4. Dollars per acre values of management regimes.
| Regime
Low, Medium, and High Stumpage Prices |
Net Present Value ($/Acre) | Annual Equivalent Income ($/Acre/Year) | Annual Equivalent Income Revenue Lost from Wildlife and Timber Management ($/Acre/Year) |
| Timber (Low) | 209.50 | 12.79 | 4.84 |
| Wildlife and Timber (Low) | 130.29 | 7.96 | |
| Timber (Med) | 250.95 | 15.33 | 4.71 |
| Wildlife and Timber (Med) | 173.89 | 10.62 | |
| Timber (High) | 296.58 | 18.11 | 4.54 |
| Wildlife and Timber (High) | 222.28 | 13.58 |
Note: Discount rate = 5%
The total expected management cost per acre is calculated from the estimates in table 2. For the timber and wildlife management regime, the present value of the total costs is $600.58 per acre. The present value of costs is calculated by adding the total costs together and discounting the value of the appropriate costs in the future. For example, any management activity/expense that occurs in year 0 is not discounted since it is already being spent in the present. However, weed control, which occurs in year 2, must be discounted. Furthermore, some of the activities that occur at a specific interval, such as prescribed fire conducted every three years, must be discounted for the specific amount and within that year. For example, the discounted cost of prescribed fire in year 14 is $14.37, but the discounted cost of prescribed fire in year 32 is $5.97. Each of the years in the prescribed fire interval must be discounted and included in the total cost.
Once the expected revenue and management costs have been calculated for each scenario (management regime and stumpage prices), a comparison of managing for timber only versus timber and wildlife based on various stumpage prices can be assessed (table 4). Remember that the calculated revenue stream for managing for timber and wildlife at a low stumpage price is $730.85 and that expected costs are $600.58. Therefore, when the costs are subtracted from the revenue, it provides a dollars per acre value in net present value of $130.29 ($730.85 – $600.58; table 4).
Looking at table 4, the result of the analysis shows that managing for timber and wildlife when stumpage prices are low will result in an expected annual loss of $4.84 per acre. While this initially appears to mean that a landowner should not manage for both timber and wildlife, adding a hunting lease to the analysis can change the results (tables 5 and 6). Even if leased lands were managed for timber only, in some parts of SC, the landowner could probably still lease their lands, although it would be for less per acre than what they would receive if they managed for wildlife.
Hunting Lease Revenue
Leasing your timberland property for the purpose of hunting can provide potential non-timber revenue. Hunting lease revenue can help offset costs incurred by landowners who manage property for objectives other than timber production and prove more profitable than timber production alone. An increase in demand for hunting land access has made leasing property an increasingly popular option for landowners.10 Hunting lease rates paid to landowners vary widely based on variables such as tract size, location, and forest management activities. In Georgia, a study found hunting lease rates ranged from $8.00 to $18.00 with an average lease rate of $12.00 per acre in 2012,11 but these rates may not be typical for all landowners.
When hunting lease revenue at various rates per acre is incorporated into the analysis, there is a gain in revenue. NPV and EAI results for the wildlife and timber management regime at the medium stumpage price values are shown in table 5. Tables 5 and 6 demonstrate that hunting lease revenue may provide a hedge against fluctuating timber prices. Additionally, a hunting lease provides an annual income stream for landowners that may help to cover annual fixed management costs, such as taxes.
Table 5. Values of wildlife/timber management regimes with hunting lease revenue ($/acre; medium stumpage prices).
| Wildlife Management with annual hunting lease | Net Present Value | Annual Equivalent Income | Revenue Gain compared to timber only management |
| $5.00/acre lease | $255.76 | $12.96 | $0.16 |
| $10.00/acre lease | $337.63 | $20.62 | $5.29 |
| $15.00/acre lease | $419.50 | $25.62 | $10.29 |
Note: Discount rate = 5%
Table 6. Joint timber and wildlife economic tradeoffs for an annual lease rate of $10 per acre per year for various stumpage prices.
| Wildlife Management with annual hunting lease | Net Present Value | Annual Equivalent Income | Revenue Gain compared to timber only management |
| Low stumpage prices | $294.03 | $17.96 | $5.16 |
| Medium stumpage prices | $337.63 | $20.62 | $5.29 |
| High stumpage prices | $386.02 | $23.58 | $5.46 |
Note: Discount rate = 5%
Benefits of a Hunting Lease Beyond Revenue
There are many benefits associated with leasing property for hunting or other recreational activities. The most obvious benefit is the annual revenue stream that can be realized by the landowner. In many cases, this annual revenue stream is necessary to cover the cost of land ownership, such as annual taxes and forest management activities.10, 12, 13 As demonstrated, while there is a tradeoff between managing solely for timber versus managing for timber and wildlife, utilizing a hunting lease as a source of revenue can provide a hedge against fluctuating timber markets and provide an annual income stream. Furthermore, income generated from a timber harvest can take years to be realized and is not a steady stream of income.
Another economic benefit of hunting leases to landowners is the potential to help reduce or minimize crop damage due to wildlife depredation. For example, damage to corn is primarily caused by white-tailed deer (Odocoileus virginianus), black bears (Ursus americanus), and wild pigs (Sus scrofa).14 White-tailed deer and bear are considered big game species, and many hunters also pursue wild pigs, which are classified as an invasive species in many states. Species available for hunting may make a hunting lease attractive to some hunters while helping to manage crop depredation.
However, other benefits to landowners that lease their land have also been identified that included reduced property damage due to trespassing and more controlled access to the property.15,16 For landowners that do not live on the property that is being leased, having hunters on the property may deter trespassing, and thus reduce property damage and liability. A study of private landowners found that many landowners consider property supervision a land management expense.12 Since hunters on leased property are likely to monitor and report illegal access to the property,15 a hunting lease may be a valuable option for landowners to decrease a management expense. Yet, the development and administration of a hunting lease may require additional time and effort from the landowner.
Hunting leases can also provide ecological benefits to the landowner and to biodiversity. Approximately 66% of all land in the United States is held in private ownership and accounts for 80% of wildlife habitat.17 In order to protect biodiversity across the landscape and provide wildlife habitat, hunting leases can help control populations of animals that may negatively impact biodiversity, such as overpopulation of deer.18 Furthermore, some landowners use hunting leases as a way to have other people help them care for their land in general.16
Hunting Lease Prices and Contracts
The amount of money a landowner can charge for a hunting lease will vary widely. Factors that influence a hunting lease price include lease size, number of hunt lease members, presence of food plots, proximity to other private and public lands, and game quality.10, 13, 19 In Georgia, the average hunting lease prices in 2008 was $12 per acre but ranged from a low of $5 per acre to a high of $25 per acre.20 A landowner will need to consider their particular property, amenities, and hunting conditions to set a lease price. One way to gauge a hunting lease price is to consider the lease prices of surrounding properties with similar characteristics and features. For example, hunting leases on a per acre basis were higher for lands with bottomland hardwoods.10 A simple internet search for available hunting leases can provide information on rates given general characteristics.
Once a landowner has decided how much to charge for a lease, the next step is to develop the hunting lease agreement. Hunting lease agreements can be very simple or complex but will likely include basic information such as the lessor and lessee, description of the property, species to be hunted, duration of the lease, and other considerations. There is no one single hunting lease that will work for every situation, so it is suggested that before a landowner enters into a hunting lease, the lease agreement should be reviewed by an attorney. An example hunt lease agreement can be found at the University of Georgia Extension website (https://bit.ly/3GmFfb9).20
Discussion/Recommendations
Using the values compiled for this analysis, there may be some opportunity cost forfeited by incorporating the wildlife and timber management model. There is, however, potential to recoup these costs and even gain revenue when compared to a traditional timber production management regime. Using a reasonable hunting lease rate of $5.00 per acre, we observe that leasing a property managed for wildlife and timber can easily break even with and increase revenue over timber-only management.9 Furthermore, using a lease rate of $10.00 and $15.00 per acre provides a significant NPV and EAI gain over the timber-only model.9 These values are based on the listed assumptions made about input costs, yields, and timber prices that vary among situations. Forest management is both a complex and long-term venture. Each individual situation will require careful consideration and evaluation. Landowners interested in promoting wildlife habitat and maximizing the NPV of their property should consider the potential benefits of hunting leases. If current trends continue with property owner objectives and demand for private hunting leases, managing property for both wildlife habitat and timber production may be a viable way to fulfill landowner objectives and provide increased monetary value to the property.
Appendix (Definition of Terms Used)
Discounting – knowing how much money is worth today assuming a specific interest rate and amount of time.
Equivalent Annual Income (EAI) – NPV of a management regime distributed annually over the length of the rotation.
Market Interest Rate – accounts for the cost of inflation in a calculation.
Net Present Value (NPV) – an estimate of how much a sum of money is worth today assuming a specific interest rate over time and is referred to as discounting.
Opportunity cost – income that is foregone to accommodate other outputs.
Real Discount Rate – an interest rate that does not account for inflation.
References Cited
- Butler BJ, Leatherberry EC. America’s family forest owners. Journal of Forestry. 2004;102(7):4–14. doi:10.1093/jof/102.7.4.
- Brandeis TJ, Brandeis C, Hartsell AJ. South Carolina’s forests, 2016. Asheville (NC): US Department of Agriculture Forest Service, Southern Research Station; 2018. Resource Bulletin SRS-215. doi:10.2737/SRS-RB-215.
- Lambert S, Danskin S, Rominger BE. Forests of South Carolina, 2017. Asheville (NC): US Department of Agriculture Forest Service, Southern Research Station; 2019. Resource Update FS–179. doi:10.2737/FS-RU-179.
- Straka TJ, Bullard SH, Dubois MT. Introduction to forestry investment analysis: Part I. Basic investment characteristics and financial criteria. 2001.
- Bullard SH, Straka TJ. Basic concepts in forest valuation and investment analysis. Forest Landowner 2001 (accessed 2021 May 17);60(6):9-14. http://scholarworks.sfasu.edu/ebooks/21.
- SC Timber Price Reports. Columbia (SC): South Carolina Forestry Commission; 2021 (accessed 2021 April 1). https://www.state.sc.us/forest/mprice.htm.
- Maggard A. Costs & trends of southern forestry practices 2018. Auburn University (AL): Alabama Cooperative Extension System; 2019. FOR-2073. https://www.aces.edu/wp-content/uploads/2019/12/FOR-2073_CostsTrendsForestry_121719L-G.pdf.
- Munn IA, Watkins CC. Mississippi consultant fees and services: by tract size and professional affiliation. Southern Journal of Applied Forestry. 2001;25(4):178–186.
- Mississippi State University. Pine forestland habitat management for wildlife. Starkville (MS): Mississippi State University, Forest and Wildlife Research Center; (accessed 2021 May 18). https://www.fwrc.msstate.edu/pubs/forestland.pdf.
- Hussain A, Munn IA, Grado SC, West BC, Jones WD, Jones J. Hedonic analysis of hunting lease revenue and landowner willingness to provide fee-access hunting. Forest Science. 2007; 53(4): 493–506.
- Poudyal NC, Bowker JM, Green GT, Tarrant MA. Supply of private acreage for recreational deer hunting in Georgia. Human Dimensions of Wildlife. 2012;17(2):141–154.
- Arano KG, Munn IA. Forest management activities and expenditures of Mississippi NIPF landowners: 1998-2000 data. Mississippi State (MS): Mississippi State University, Forest and Wildlife Research Center; 2004. Bulletin FO 249. https://www.fwrc.msstate.edu/pubs/nipf.pdf.
- Mingie JC, Poudyal NC, Bowker JM, Mengak MT, Siry JP. Big game hunter preferences for hunting club attributes: A choice experiment. Forest policy and economics. 2017 May;78:98–106.
- McKee SC, Shwiff SA, Anderson AM. Estimation of wildlife damage from federal crop insurance data. Pest Management Science. 2021 Jan;77(1):406–16.
- Marsinko AP, Smathers Jr WM, Guynn Jr DC, Stuckey Jr GL. The potential economic effect of lease hunting on forest management in the southeast. Southern Journal of Applied Forestry. 1992 Nov;16(4):200–203.
- Teasley RJ, Bergstrom JC, Cordell HK, Zarnoch SJ, Gentle P. Private lands and outdoor recreation in the United States. In: Cordell HK, editor. Outdoor recreation in American life: a national assessment of demand and supply trends. Champaign (IL): Sagamore Publishing; 1999. p. 183–218.
- Benson DE. Wildlife and recreation management on private lands in the United States. Wildlife Society Bulletin. 2001 Apr;29(1):359–371. doi:10.2307/3784021.
- Mingie JC, Poudyal NC, Bowker JM, Mengak MT, Siry JP. A hedonic analysis of big game hunting club dues in Georgia, USA. Human Dimensions of Wildlife. 2017 Mar;22(2):110-25. doi:10.1080/10871209.2017.1263767.
- Mingie JC, Poudyal NC, Bowker JM, Mengak MT, Siry JP. Comparing the net benefit of forestland access for big-game hunting across landownership types in Georgia, USA. Forest Science. 2019 Apr;65(2):189–200.
- Mengak, Michael T. Tips for creating a hunting lease. Athens (GA): University of Georgia Cooperative Extension; 2009. Circular 971.