South Carolina forest landowners have a unique opportunity to conserve their forestland and make money while doing so. Trees remove carbon from the atmosphere through a process called carbon sequestration in which the carbon is stored in the woody parts of the tree. Carbon markets that exist in California will often pay forest landowners to keep their trees on their land to adsorb carbon.
Carbon offset credits are a measurement of carbon sequestered in trees, and these credits can be sold to industries that participate in the California Carbon Market (CCM) and other voluntary offset markets. Landowners in South Carolina and elsewhere who conserve their forests have the opportunity to produce and sell these carbon credits. Active forest management that maximizes carbon sequestration through thinning, prescribed fire, and uneven-aged harvesting are typical activities that are allowed under improved forest management protocols for carbon credit generation. These types of forest management activities and conservation can provide South Carolina landowners with an additional or primary income stream when the credits are sold to the carbon market.
The California Carbon Market, codified in 2006, requires that certain polluting industries in the state of California (CA) be required to purchase carbon credits to offset their emissions to a certain level. The goal of this program is to bring carbon emissions from these industries to pre-1990 atmospheric CO2 levels by 2020, and 40% below 1990 levels by 2030.1 Industries whose emissions are above the required level must purchase credits while industries below their emissions requirement can sell credits. Industries purchase most of their credits from other industries that are under the requirements for their emissions. Still, the other source of credits comes from landowners who are actively sequestering carbon on their forestlands. Landowners that work with carbon developers and offset registries (organizations that verify and sell carbon credits) can make between $12.00 and $18.00 per ton of carbon sequestered in their forestlands.2 For the compliance market through the CCM, landowners are required to put their forestland on a conservation easement for one hundred years and verify the additional carbon sequestered every six years.
Another option for landowners who are not interested in a one hundred-year conservation easement is to participate in a voluntary market. Voluntary markets are for corporations or individuals that are interested in purchasing credits to offset their own emissions as opposed to the requirement for polluting industries in CA to offset their emissions through the CCM. The credit issuing process goes through the same project developers as the CCM, but the requirements for entering forestland into the market are not as strict as the compliance market. Voluntary programs often do not require a one hundred-year conservation easement and may allow more robust timber harvesting regimes.
Research carried out by the Department of Forestry and Environmental Conservation at Clemson University analyzed different forest management practices to determine which practices would sequester the most carbon. The goal was to maximize both revenue and co-benefits, such as wildlife habitat and increased water quality, from a carbon project for South Carolina forest landowners.
Methods
A variety of forest types, forest ages, and locations across South Carolina were analyzed to determine variations in carbon sequestration. One hundred thirty Forest Inventory Analysis (FIA) one-acre plots were chosen to be modeled for one hundred years.3 FIA data is collected by both federal and state forestry agencies, and this data can be utilized in the Forest Vegetation Simulator, a modeling software produced by the Forest Service, to predict how certain management practices will affect carbon sequestration over one hundred years. Baseline carbon values from 2016 were used as inputs in the model. Figure 1 shows the location and forest type of each modeled plot. The four major forest types studied were Loblolly pine, Longleaf pine, Oak/Gum/Cypress forest, and Oak/Hickory forests. Plots were selected based on age and location within the state. To demonstrate the variance in carbon sequestration among different age stands, three stands (depending on data availability) within each statistically determined age group were selected for modeling based on location within the state and forest type.4
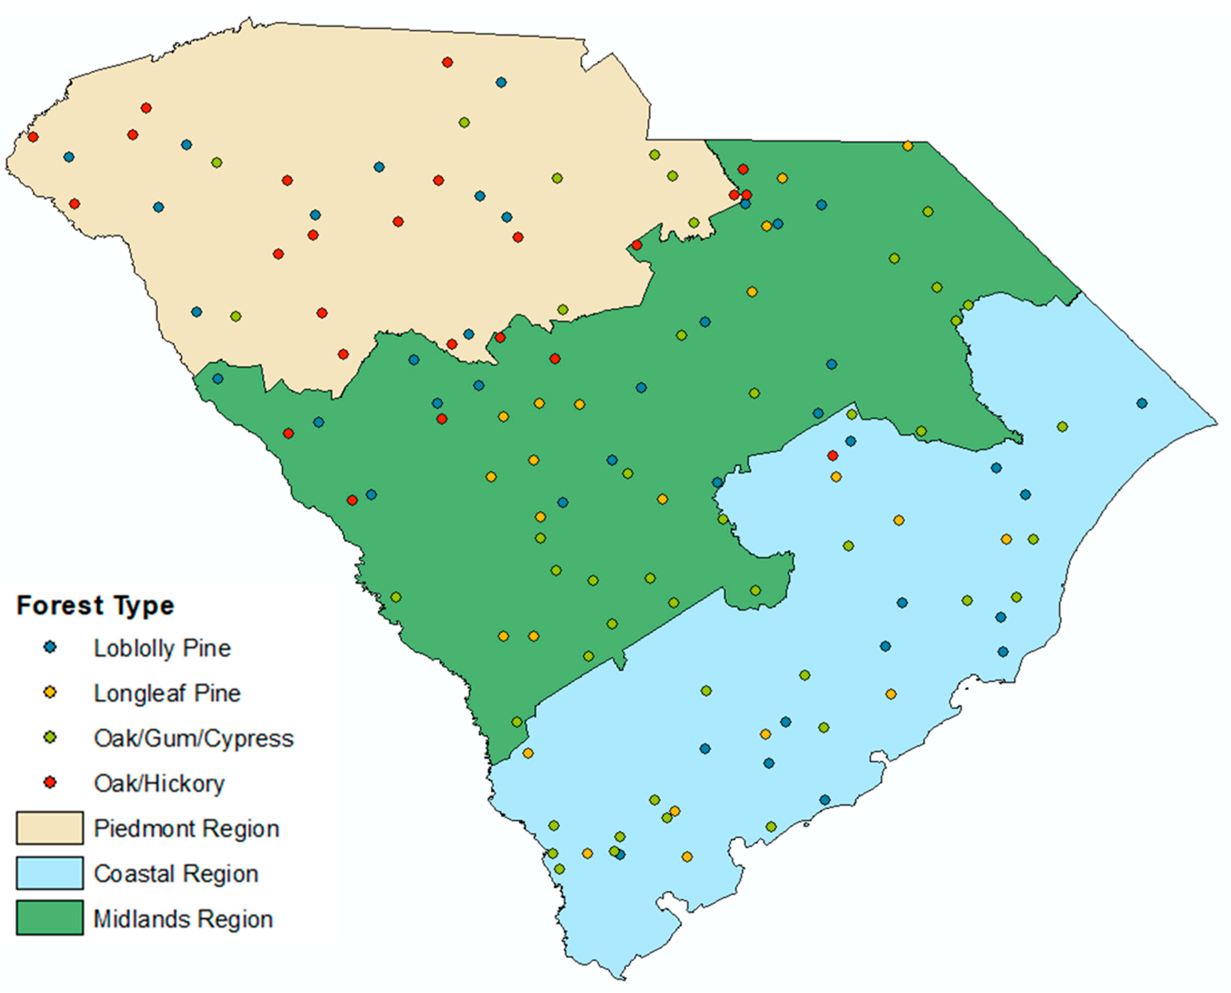
Figure 1. Modeled plot locations and forest types.4 Image credit: Lucas Clay, Clemson University.
Ten different management scenarios were modeled for each plot to determine variances in carbon sequestration. These management scenarios were selected due to their prevalence and importance in southern forest management. Each management practice is listed below:
- Clear cut three times over one hundred years
- Clear cut three times over one hundred years with artificial regeneration
- Thin from below three times over one hundred years
- Clear cut once then artificial regeneration
- Thin from below every fifteen years
- Thin to Q-factor: uneven-aged thinning – every twenty years
- Thin to Q-factor: uneven-aged thinning – every thirty years
- Prescribed fire – every seven years
- Prescribed fire – every three years
- No management
Results
One thousand two hundred thirty-four scenarios were generated from all of the plots. These scenarios showed that certain management practices were more effective at sequestering carbon than others. Overall, scenario 10 (No Management) was most effective at retaining carbon, as no forest products or woody debris was removed from the forest. Scenario 5 (thin from below every fifteen years) and 3 (thin from below three times over one hundred years) both maximized carbon sequestration while allowing for land management (thinning). These thinning regimes help reduce down woody debris; they provide opportunities for larger trees to succeed and sequester carbon, enhance wildlife habitat, and reduce the potential for wildfire occurring from excess woody debris.
A ratio value was given to every management practice for each plot modeled to normalize the amount of carbon sequestered by each plot. The ratio value was calculated using the following equation:
Ratio Value = ACS/Baseline Value
ACS (Average Carbon Sequestration) = 20, 5-year cycle carbon values (over one hundred years) averaged together
Baseline Value = 2016 carbon value from Forest Inventory Analysis Data
Table 1 shows the ratio value for each management scenario by location in the state and forest type. The averages include all stand ages. All plots with a value of 1.0 or below were plots that had negative values for carbon sequestration over one hundred years. Plots with a value of 1.0 or greater had positive values for carbon sequestration over one hundred years. Table 2 shows the average ratio values for each management practice for each region, with the goal of giving a high-level overview of viable management practices for carbon sequestration in South Carolina. Values in red are below 1.0, indicating an inadequate management practice for the carbon market. Values in black are above 1.0, indicating positive carbon sequestration and a potentially viable management practice for the carbon market. Values in green indicate that scenario 10 (No management) was the best option for carbon sequestration. The values in blue for scenarios 3, 5, and 6 indicate that there are adequate second options for management that may also help manage wildlife and reducing the potential for wildfire.
Table 1. Average ratio values for each forest type and management scenario based on location.
| Loblolly | Ratio-M. 1 | Ratio-M. 2 | Ratio-M. 3 | Ratio-M. 4 | Ratio-M. 5 | Ratio-M. 6 | Ratio-M. 7 | Ratio-M. 8 | Ratio-M. 9 | Ratio-M. 10 |
| Coast | 0.8 | 0.8 | 2.0 | 1.5 | 2.1 | 1.3 | 1.2 | 1.6 | 1.3 | 2.1 |
| Midlands | 0.8 | 0.9 | 2.0 | 1.5 | 2.1 | 1.4 | 1.3 | 1.7 | 1.4 | 2.2 |
| Piedmont | 0.9 | 1.0 | 3.0 | 2.3 | 3.2 | 2.3 | 2.0 | 2.4 | 1.9 | 3.4 |
| Longleaf | Ratio-M. 3 | Ratio-M. 5 | Ratio-M. 6 | Ratio-M. 7 | Ratio-M. 8 | Ratio-M. 9 | Ratio-M. 10 |
| Coast | 2.1 | 2.2 | 2.3 | 1.9 | 1.8 | 1.3 | 3.0 |
| Midlands | 1.8 | 1.8 | 1.6 | 1.4 | 1.6 | 1.2 | 2.2 |
| Oak-Hickory | Ratio-M. 1 | Ratio-M. 2 | Ratio-M. 3 | Ratio-M. 4 | Ratio-M. 5 | Ratio-M. 6 | Ratio-M. 7 | Ratio-M. 8 | Ratio-M. 9 | Ratio-M. 10 |
| Midlands | 0.8 | 0.7 | 1.8 | 1.2 | 1.8 | 1.3 | 1.1 | 1.5 | 1.4 | 1.8 |
| Piedmont | 0.9 | 0.9 | 2.0 | 1.5 | 2.0 | 1.4 | 1.3 | 1.7 | 1.5 | 2.1 |
| Oak/Gum/Cypress | Ratio-M. 1 | Ratio-M. 2 | Ratio-M. 3 | Ratio-M. 4 | Ratio-M. 5 | Ratio-M. 6 | Ratio-M. 7 | Ratio-M. 8 | Ratio-M. 9 | Ratio-M. 10 |
| Coast | 1.3 | 1.2 | 2.7 | 2.4 | 2.8 | 2.1 | 1.9 | 1.8 | 1.3 | 2.9 |
| Midlands | 1.1 | 1.1 | 2.6 | 2.3 | 2.7 | 2.0 | 1.7 | 1.8 | 1.2 | 2.8 |
| Piedmont | 0.7 | 0.7 | 1.6 | 1.1 | 1.6 | 1.0 | 0.9 | 1.3 | 1.0 | 1.6 |
Table 2. Average ratio values for each forest type across the state.
| Mgmt.1 | Mgmt.2 | Mgmt.3 | Mgmt.4 | Mgmt.5 | Mgmt.6 | Mgmt.7 | Mgmt.8 | Mgmt.9 | Mgmt.10 | |
| Loblolly | 0.9 | 0.9 | 2.3 | 1.8 | 2.5 | 1.7 | 1.5 | 1.9 | 1.5 | 2.6 |
| Longleaf | 1.9 | 2.0 | 2.0 | 1.7 | 1.7 | 1.2 | 2.6 | |||
| Oak-Hickory | 0.9 | 0.8 | 1.9 | 1.4 | 1.9 | 1.4 | 1.2 | 1.6 | 1.4 | 2.0 |
| Oak/Gum/Cypress | 1.1 | 1.1 | 2.5 | 2.2 | 2.6 | 1.9 | 1.7 | 1.7 | 1.2 | 2.7 |
Discussion
Most of the management practices used in this study would be acceptable for implementation in South Carolina forests with the goal of carbon sequestration. A tool developed from the data in this study will allow landowners to choose forest characteristics and management parameters that interest them (e.g., forest type, age, management practice, etc.) and read the carbon sequestration projections that would result from these chosen parameters. This tool gives landowners an idea of how much carbon they could sequester on their land. It will also provide additional details about the management practices modeled in this study. A Microsoft Excel tool is provided by the Clemson Extension Forestry and Natural Resources Program team, and can be acquired by contacting one of the authors of this publication (Marzieh Motallebi at mmotall@clemson.edu). Additionally, the original publication for this research is provided on MDPI’s website (mdpi.com/560494).4
There are many benefits and challenges associated with entering forestland in the California Carbon Market. Carbon sequestration and reducing deforestation will aid in mitigating climate change associated with increased carbon in the atmosphere. There are also many co-benefits to managing your forest for carbon, especially the protection of wildlife with the potential for hunting areas. Furthermore, conservation of forestland will enhance water quality in the region and increase soil health.
One major requirement for entering the compliance market is that land needs be placed under a one-hundred-year conservation easement for carbon sequestration. This is currently required to participate in the compliance market (the market for California industrial offsets). Still, there are other options through the voluntary market to place land under a conservation easement for a shorter time period. Additionally, certain forestry protocols must be followed to assure the carbon sequestered is real, permanent, additional, enforceable, and verifiable.5 When utilizing the voluntary market, there are other protocols that allow for the management of long-life forest products and other types of forest management. All protocols require a third-party company to measure the trees and model carbon sequestration for the conservation easement period. Because of this, additional costs are incurred to pay for these services. The income from the credits can offset these costs, but due to these additional costs, the general rule is that you must have between 2,000 and 3,000 acres of land to make a profit in the compliance market still. There may be additional opportunities to use smaller land tracts in the voluntary market due to the flexibility in the management protocols.
If you are interested in additional information, options for participating in the carbon market, or have questions, please email Lucas Clay at clay9@clemson.edu or Marzieh Motallebi at mmotall@clemson.edu.
References Cited
- Ye J. Summary of california’s extension of its cap-and-trade program. 2017. https://www.c2es.org/site/assets/uploads/2017/09/summary-californias-extension-its-cap-trade-program.pdf.
- California Carbon Dashboard: Carbon Prices, the Latest News, and California Policy. 2015 [accessed 2020 April 22]. http://calcarbondash.org/.
- Forest Inventory and Analysis Database. St. Paul (MN): U.S. Department of Agriculture, Forest Service, Northern Research Station. 2019. https://apps.fs.usda.gov/fia/datamart/datamart.html.
- Clay L, Motallebi M, Song B. An analysis of common forest management practices for carbon sequestration in South Carolina. Forests. 2019:10(11):949.
- Climate Action Reserve. 2015. http://www.climateactionreserve.org/.