Streamflow tells us how much water is flowing past a certain point in a stream or river. Streamflow (or discharge) affects almost all aspects of stream health, including essential biological and chemical processes. Many institutions, agencies, organizations, and landowners rely on an accurate accounting of streamflow for the estimation of pollutant and nutrient loading, prediction of flood levels, and other environmental management activities. This publication addresses key questions about streamflow for land and water management professionals, state agencies, Extension Agents, city planners, and research institutions: What is it? Why is it measured? Who measures it? How is it measured? And where is it measured? In this case, “where” refers to either the stream or conveyance structure (such as culverts) where streamflow is measured and how that determines methods used for measurement or estimation of streamflow.
What is Streamflow?
The United States Geological Survey (USGS) defines streamflow as “the volumetric rate of flow of water (volume per unit time) in an open channel, including any sediment or other solids that may be dissolved or mixed with it that adhere to the Newtonian physics of open-channel hydraulics of water.”1 Discharge addressed in this document is in reference to open channel flow or the passage of water through streams, culverts, and other non-pressurized conveyances. Generally, discharge Q (ft3/s or m3/s) is calculated as the velocity v (ft/s or m/s) of water moving through a unit area A (ft2 or m2):
Q = v * A
Measures of discharge can range widely depending on the size and location of the stream as well as groundwater levels and recent precipitation. For example, the average discharge in the Mississippi River at Baton Rouge, Louisiana, ranges between 308,000 and 843,000 ft3/s (or cfs). Average discharge in the Saluda River near Greenville, South Carolina, ranges between 347 and 1040 cfs, and discharge in small, shallow streams in South Carolina is often below a single (1.0) cfs.2
Why Measure Streamflow? Who Measures It?
Federal agencies, such as the USGS, state and local agencies that monitor water quality, and environmental firms measure streamflow. The USGS manages over 8,200 streamgages that give discharge information that can be used for environmental monitoring, flood prediction, lock and dam management, and recreational safety.3
Stream stage is often referenced when discussing river conditions and the quantity of water within a river. Stream stage refers to how high the water surface is above a pre-defined elevation point in the stream which is often the streambed or even an absolute elevation. Rises and falls in the stream stage (also referred to as stage or gage height) indicate changes in streamflow. This relationship between stream stage and discharge is referred to as the stage-discharge relationship. Stream stage can be measured using sensors such as pressure transducers, water level radar, bubblers, and cameras, or stage can be measured using staff gauges (picture in figure 1), crest-stage gauges, or measure-downs from a defined point. Stream stage is then related to a series of stream discharge measurements across a wide range of streamflow conditions to create a stage-discharge relationship or rating curve (figure 2). This rating curve can then be used to estimate flow during most flow conditions within a range of flow measurements, assuming consistent boundary conditions.3 Rating curves should be updated as vegetation, erosion, and sedimentation affect discharge in the stream section, which vary in some streams to a near-constant state of change to an almost completely steady state.1,4
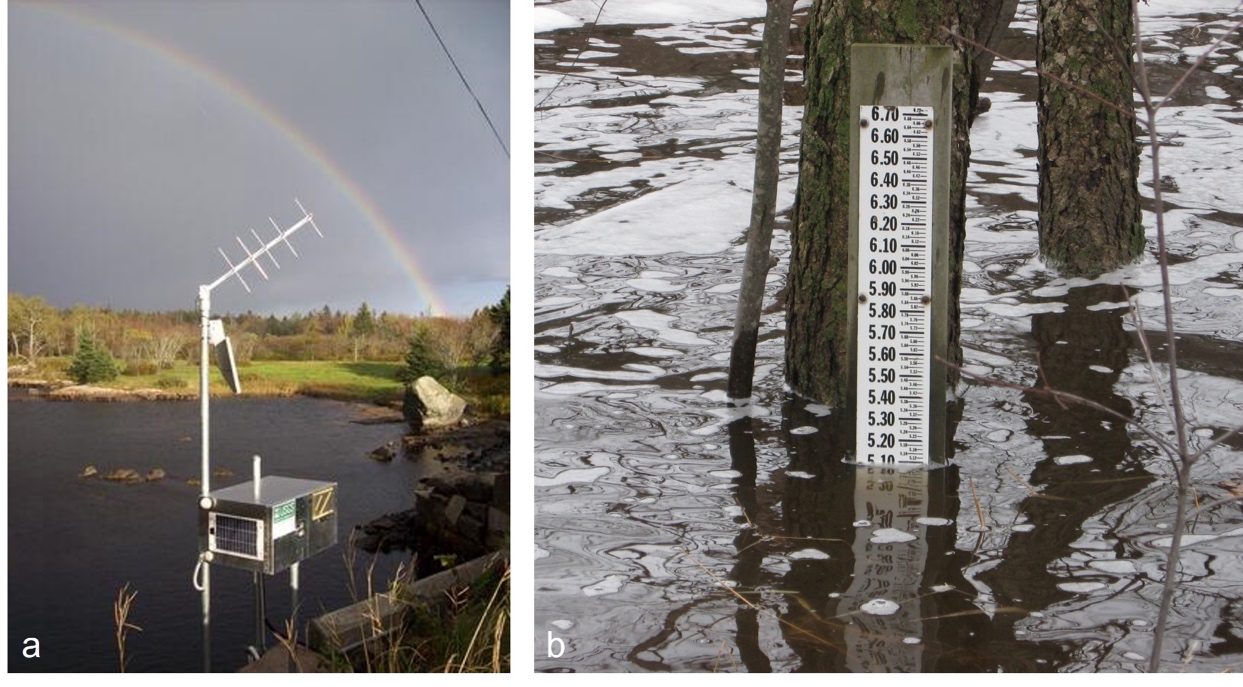
Figure 1. The methods that the United States Geological Survey uses to measure stream stage can vary from data-transmitting streamgages (a) to ruler-like staff gages (b). Image credit: Robert Swanson, United States Geological Survey; USGS Wisconsin Water Science Center.
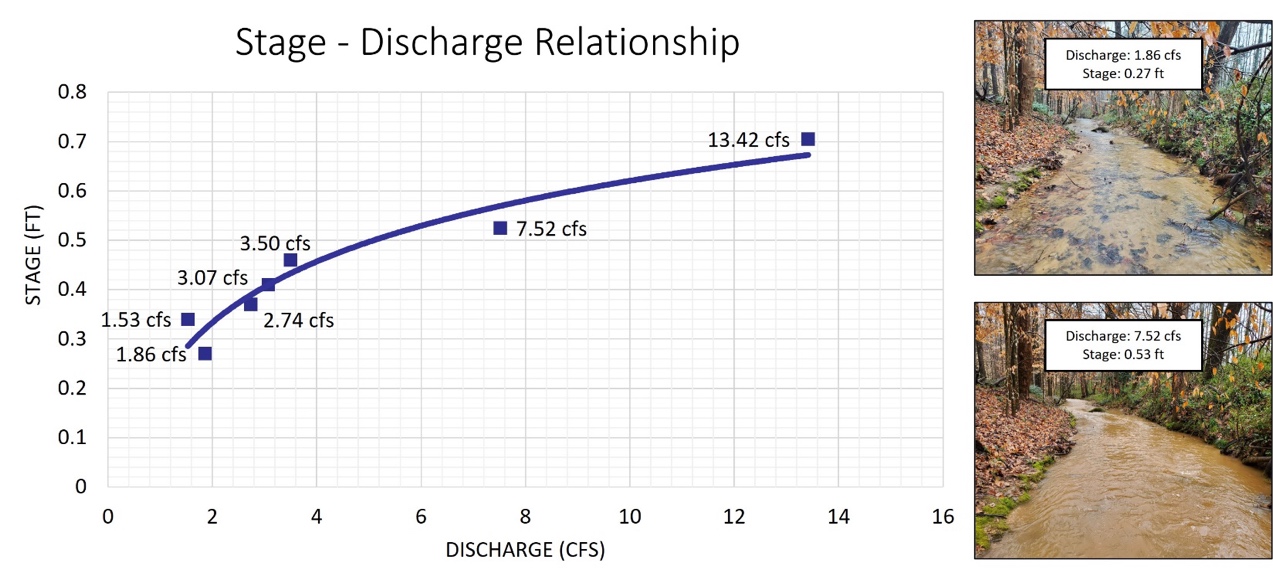
Figure 2. Constructed from discrete measurements of stage and discharge, rating curves are used to estimate discharge across a range of stages. Image credit: Meredith Brock, Clemson University.
How Streamflow Is Measured in Wadeable Open Channels
The size and discharge of the stream or river will determine the method and instruments used for measurement. The following methods and guidance are applicable for direct measurement of discharge in wadeable streams. At the site of measurement, a cross-section is identified as a conceptual line crossing the stream perpendicular to the flow direction. This cross-section is divided into smaller sections (also known as subareas, profiles, or partial sections) of known width at which velocity is measured (figure 3). The USGS recommends using between twenty-five to thirty subsections, but as a general rule, subsections should ideally contain less than 5 percent of the total discharge of the cross-section and no more than 10 percent. As mentioned previously, total discharge at one cross section is the total sum of multiplying velocities and areas (velocity-area method) in subsections and is most practically understood this way. Two computational methods, the mean-section method and the midsection method, use the velocity-area approach to measure widths, depths, and velocities in order to calculate discharge.5 Most current meter instruments employ the midsection method, and for this reason, only the midsection method will be detailed here.
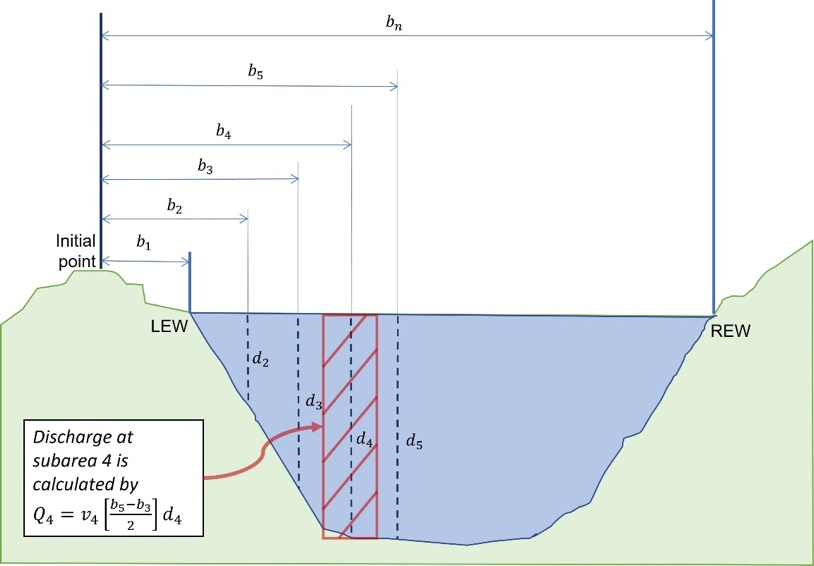
Figure 3. The initial point is the point at which the tag line or measuring tape begins. Widths are measured in reference to this point, starting at the left edge of water (LEW) moving toward the right edge of water (REW). The flow direction in this figure is from the reader toward the page. Image credit: Meredith Brock, Clemson University.
Velocity-Area Method of Discharge Calculation
Discharge Q (ft3/s or m3/s) is most practically understood as the sum of the discharges of all subareas or the sum of multiplying known velocity v (ft/s or m/s) and area A (ft2 or m2) in each subarea of the cross section of the stream. This is symbolically written as:
![]()
![]()
Where n represents the number of subareas and Qt is the total discharge of the cross section. Numeric subscripts refer to the subarea.1
Midsection Method
USGS protocols and most instruments that calculate discharge employ the midsection method. This method calculates the width of the subareas as the midway distance between observation points. For example, if velocity is measured at 1-ft, 2-ft, and 3.5-ft points, the width of the subarea where velocity is measured at the 2-ft point would be the sum of half the distance to the previous point (1/2 = 0.5 ft) and half the distance to the next point (1.5/2 = 0.75 ft) for a total width of 1.25 ft (0.5 + 0.75 = 1.25 ft). This can alternatively be calculated as half the distance between neighboring observation points (3.5 – 1 = 2.5; 2.5/2 = 1.25 ft).
Referencing figure 3, the partial discharge for any subarea is calculated by:
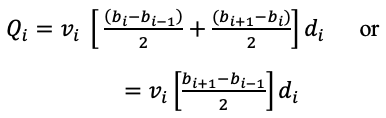
Where Qi is the discharge through subarea i, vi is the mean velocity at location i, bi is the distance from the initial point to each location i, bi-1 is the distance from the initial point to the preceding location, bi+1 is the distance from the initial point to the next location, and di is the depth of water at each location i. Distances and depths should be measured in feet or meters, keeping consistent units (US customary or metric) for all parameters. The total discharge is the sum of the discharges in all subareas.1
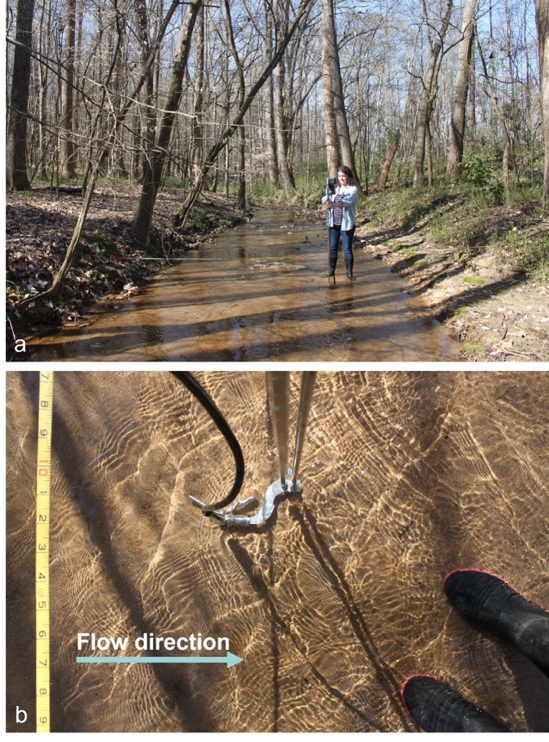
Figure 4. The tag line is stretched across the stream channel perpendicular to flow. Ideally, discharge is measured in a straight channel section with minimal obstructions (a). The operator should hold the wading rod upright and stand behind the instrument to not interfere with the current and streamflow measurement (b). Image credit: Meredith Brock, Clemson University.
Direct Measurement of Streamflow
Steps and Where to Measure
General steps taken in measuring discharge at a stream cross-section include the following:
- Find a representative section of the stream to measure discharge. The channel should be straight with minimal obstructions like rocks and vegetation. Water in this section should be flowing parallel to the banks with sufficient depth to measure velocity (figure 4). Most instruments require at least 3 inches of water.
- Stretch a tag line or measuring tape level across the width of the stream perpendicular to the flow direction. When facing downstream, the tag line should begin at the left edge of water (LEW) and stretch to the right edge of water (REW) (figure 4).
- Determine subarea spacing and depth measurement method. Subareas should be wider in slower-moving areas and narrower in faster-moving sections. One subarea should not contain more than 10% of the total discharge.
- Starting at LEW, take measurements and record readings of each subarea in an instrument or in a field notebook.
- Calculate discharge.
- Measure again if one subarea contains more than 10% of the total discharge. Alternatively, additional subareas may be added (and surrounding subareas recalculated).
Instrumentation and Sensors
Top-Setting Wading Rod
Depending on the water depth and conditions, water velocity is measured at 0.2, 0.6, or 0.8 times the total water depth measured from the water surface. The six-tenths-depth (0.6-depth) method is used when the water depth is under 1.5 ft, and there are no significant differences in velocities at different depths. If depths are over 2.5 ft or velocities differ widely from streambed to water surface, a combination of 0.2-, 0.6-, and 0.8-depth methods should be used.1

Figure 5. The top-setting wading rod (a) is used to position velocity sensors at a known depth in the stream. The rod is comprised of two separate rod pieces: the graduated rod (b) and the suspension rod, which aligns with the Vernier scale on the graduated rod (c). Image credit: Meredith Brock, Clemson University.
For in-stream discharge measurements, a top-setting wading rod is used to position the sensor at the required depth (figure 5). The wading rod is comprised of 2 individual rod pieces: a graduated rod and a suspension rod. The graduated rod is marked by grooves, and if in US customary units, each triple groove is 1.0-ft graduation, each double groove is 0.5-ft graduation, and each single groove is 0.1-ft graduation. The suspension rod holds the sensor and is marked by lines signifying the depth in feet. The sensor is attached to the suspension rod and will be raised or lowered according to the water depth and calculated measurement depth. Depending on the measurement method, the suspension rod will align with the markings on the Vernier scale on the top of the wading rod shown in figure 5. The Vernier scale is an adjusted scale that is a fraction of the main scale on the suspension rod. Each marking corresponds to a 0.1-ft increment on the suspension rod.6,7
To position the sensor at the correct depth, multiply the water depth by the multiplier for the measurement method shown in table 1. For example, the multiplier for the 0.6-depth is 1.0, and the multiplier for the 0.2-depth is 2.0. Once the calculated reading is determined, line up the appropriate 1-ft increment on the suspension rod with the appropriate 0.1-ft increment on the Vernier scale. Aligning these values will position the sensor at the appropriate depth for the measurement method. For example, for a water depth of 1 ft using the 0.6-depth method, the suspension rod would be adjusted to align the 1-ft marking on the suspension rod with the 0 on the Vernier scale. Alternatively, the 0-ft marking will align with the 10 on the Vernier scale. This would place the sensor at a depth of 0.6 ft from the water’s surface or 0.4 ft from the streambed. See table 2 for more examples of water depth, multipliers, calculated reading, and actual measurement depth.
Table 1. Top-setting wading rod depth multipliers.
| Depth | 0.2-depth | 0.4-depth | 0.6-depth | 0.8-depth |
|---|---|---|---|---|
| Multiplier | 2.0 | 1.5 | 1.0 | 0.5 |
Table 2. Examples of use in top-setting wading rod.
| Water depth | Measurement depth method | Corresponding multiplier | Calculated reading (for alignment of suspension rod and Vernier Scale) | Actual depth of sensor (from streambed) |
|---|---|---|---|---|
| 1 ft | 0.6-depth | 1.0 | 1.0 | 0.4 ft |
| 1 ft | 0.8-depth | 0.5 | 0.5 | 0.2 ft |
| 2 ft | 0.2-depth | 2.0 | 4.0 | 1.6 ft |
| 2 ft | 0.8-depth | 0.5 | 1.0 | 0.4 ft |
| 2 ft | 0.6-depth | 1.0 | 2.0 | 0.8 ft |
Velocity Measurement by Current Meters
Several instruments can be attached to the suspension rod of the top-setting wading rod to measure velocity in the stream. Mechanical methods include the Pygmy current meter and USGS Type AA current meter or Price-Type current meter. With these methods, cups arranged around a shaft spin with varying degrees of speed according to the velocity in the stream. The number of rotations can be manually counted by sound or recorded by a digital counter. These devices may also use sounding lines and weights as an alternative to the wading rod if wading is not possible where the meters are suspended from a bridge, boat, or other location above the water.1,8
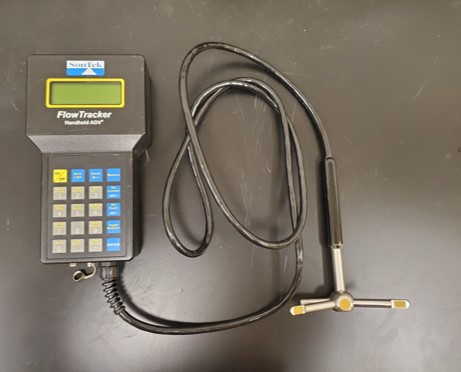
Figure 6. Instruments like the SonTek FlowTracker require width, depth, and method inputs and measure velocity using an acoustic doppler velocimeter. Image credit: Meredith Brock, Clemson University.
Acoustic doppler velocimeters (ADV) measure the velocity in the stream by measuring the average velocities of small material passing the sensor.1 Some ADVs like the Sontek FlowTracker2, Hach FH950, and OTT MF pro have digital interfaces to input subarea widths and depths and internally calculate discharge. While no longer available since technology upgraded to the Sontek FlowTracker2, the Sontek FlowTracker is shown in figure 6 as an example of an ADV handheld device still in use by some organizations. Other ADVs, like the Marsh-McBirney Flo-Mate, only measure velocity similar to the mechanical methods, and the user must record widths, depths, and velocity measurements in a field notebook or other device.
As technological complexity varies between instruments, prices vary. For example, USGS Pygmy current meters start at $1,400, and OTT flow meters are around $4,300. Available with either meter or foot graduations, wading rod prices start at $1,000.9,10
How Streamflow Can Be Estimated in Culverts and Pipes
For sections of the stream that flow through culverts or pipes, direct measurement of discharge may not be possible. In these cases, Manning’s formula may be used to estimate velocity v (ft/s) in the pipe:
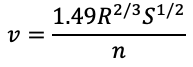
Where R represents the hydraulic radius (ft) which is the area of water in the pipe divided by the wetted perimeter (ft). The geometry of the pipe and water level will determine area, hydraulic radius, and wetter perimeter. Calculations are unique for the channel shape, whether circular, trapezoidal, or rectangular. The coefficient 1.49 is used if calculating in US customary units, and 1.00 should be used instead if using SI units. Wetted perimeter is the sum of all surfaces in contact with water. S represents the slope of the pipe in ft/ft, and n is the unitless Manning’s roughness coefficient which describes the material of the pipe.11 Roughness coefficients (also known as Manning’s n value) for common pipe materials are listed in table 3. Manning’s equation may also be used to estimate velocity in open channels. While direct measurement will capture the variability in open channels, using Manning’s to estimate velocity will assume a constant velocity across the cross section.
Table 3. Recommended Manning’s coefficients (n) for common pipe or culvert materials.12
| Pipe or culvert material | Manning’s n value |
| Concrete | 0.010-0.012 |
| Corrugated metal, partially full | 0.0240 |
| PVC | 0.009-0.011 |
Alternative Methods to Measuring Streamflow
If channels are not wadeable or conditions are not conducive to using wading rods or sounding lines, an acoustic doppler current profiler may be a suitable alternative. This device is attached to a manned or tethered boat, moves along the cross section while scanning the water profile, and characterizes discharge within the cross section. It provides higher resolution of velocities and discharge in the cross section as well as takes less time than current meter methods. This method is favored in deeper streams and is often used to measure discharge in unsteady flow conditions, such as in areas near dams or control structures or areas with backwater.1,13
While the previous methods reviewed velocity-area methods for determining discharge, other methods include tracer-dilution methods and the use of hydraulic structures like weirs and flumes. Both of these methods are useful in high and low discharge settings or where the use of velocity meters is limited. Tracer-dilution methods involve injecting a tracer (salt or fluorescent dye) into the stream, allowing mixing and dilution in the channel, and measuring the tracer concentration at a defined distance downstream. This concentration and distance can then be related to a discharge.14,15 Weirs allow water to accumulate in a pool behind an outlet structure, and water depth in this pool is used to estimate discharge. Flumes constrict flow to a narrow channel, and discharge is estimated from the water level in this channel.15,16 Commercially available weirs and flumes have a pre-defined stage-discharge relationship and don’t require the user to develop one like in the case of velocity-area methods.
Summary
While there are multiple methods to calculate streamflow, the method to use is decided by the user and organization policies. While methods to estimate or measure streamflow differ for open channels or culverts, the idea is the same in that both use the velocity of the stream and the cross-sectional area of water. By understanding these basic principles and others in this article, users can make the correct decision that is best suited for their application. The authors recommend that users should first consult the policies and requirements of their organization before selecting a streamflow measurement method. Readers should also consult manuals and guidelines from federal agencies like USGS and the Bureau of Reclamation that offer more details on discharge measurement.
References Cited
- Turnipseed DP, Sauer VB. Discharge measurements at gaging stations. In: U.S. Geological Survey Techniques and Methods. 3-A8. Reston (VA): U.S. Geological Survey; 2010. 87 p.
- USGS. National Water Information System: Web Interface. USGS Water Data for the Nation. Reston (VA): U.S. Geological Survey; c2023. https://waterdata.usgs.gov/nwis
- USGS. Water Science School. How Streamflow is Measured. Reston (VA): U.S. Geological Survey; 2018 Jun 13. https://www.usgs.gov/special-topics/water-science-school/science/how-streamflow-measured?qt-science_center_objects=0#qt-science_center_objects
- Fondriest Environmental, Inc. Streamflow Measurements. Fundamentals of Environmental Measurements. Fairborn (OH): Fondreist Environmental, Inc.; 2015 Sep 17. https://www.fondriest.com/environmental-measurements/measurements/hydrological-measurements/streamflow-measurements/
- Herschy R. The velocity-area method. Flow Measurement and Instrumentation. 1993 Jan;4(1):7–10. doi:10.1016/0955-5986(93)90004-3.
- Kentucky Division of Water (DOW). Measuring stream discharge standard operating procedure. Frankfort (KY): Kentucky Department for Environmental Protection, Division of Water; 2020.
- HyQuest Solutions. Instruction Manual Top Setting Wading Rods – Model TSR. Lake Worth (FL): HyQuest Solutions America/KISTERS Group. www.hyquestsolutions.com.au.
- Geo Scientific Ltd. Flow & Current Meters. Vancouver (BC): Geo Scientific Inc; c2001. http://www.geoscientific.com/flowcurrent/AA_Current_Meter.html.
- Fondriest. Hydrology. 2023. https://www.fondriest.com/products/hydrology.htm.
- PRP. Hydrological Equipment. Columbus (OH): Performance Results Plus, Inc.; c2023. https://prph2o.com/usgs-pygmy-current-meter/.
- Lindell JE, Moore WP, King HW. Handbook of hydraulics. 8th ed. New York (NY): McGraw-Hill; 2017.
- American Concrete Pipe Association. Manning’s n values: history of research. Irving (TX): American Concrete Pipe Association (ACPA); 2007. Design Data 10 (11/12). https://resources.concretepipe.org/dd10-mannings-n-values-history-of-research.
- Gotvald AJ, Oberg KA. Acoustic doppler current profiler applications used in rivers and estuaries by the US Geological Survey. Reston (VA): U.S. Geological Survey; 2018. U.S. Geological Survey Fact Sheet 2008–3096, 4 p.
- Kilpatrick FA, Cobb ED. Measurement of discharge using tracers. In: U.S. Geological Survey, techniques of water-resources investigations) 3-A16. Reston (VA): U.S. Geological Survey;1985. 52 p. https://pubs.usgs.gov/twri/twri3-a16/.
- US Bureau of Reclamation. Water Measurement Manual. Washington (DC): US Department of the Interior: 2001. https://www.usbr.gov/tsc/techreferences/mands/wmm/index.htm
- Adeogun AG, Mohammed AA. Review of methods of measuring streamflow using hydraulic structures. In: Ahsan A, editor. Hydraulic structures – theory and applications. London (GB): IntechOpen; 2020. doi:10.5772/intechopen.82342.