Project-based learning is a common teaching method that allows students to learn by becoming active participants in real-world and meaningful projects.1 With these projects comes the need for communication and information sharing. The purpose of this publication is to establish an understanding of the effectiveness of different methods of digital communication—a traditional Gantt chart, emails, and Short Message Services (SMS, also known as text messaging)—for students working in project teams for a university course. The experience presented in this publication stemmed from a semester-long project and the reflections of a graduate student team leader and the co-author of this article about aspects of group management they encountered with the students.
Introduction
Student teamwork is a frequent necessity in educational settings, as project-based learning is a teaching method generously employed.1 With this teaching method, students must take charge of their social and academic skills, learning to cooperate and communicate effectively with their peers.2 However, with large assignments, time management is often a hurdle, as university students can struggle with procrastination.3 For successful collaboration and time management in project-based assignments, efficient project management is required. Project management is a technique that addresses establishing, planning, coordinating, and scheduling tasks to ensure project success.4 The means of project management communication is essential as well. One way to facilitate this communication is through digital technology, as most of today’s students are accustomed to integrating digital technology within the school setting.
Three examples of project management communication using digital technology are Gantt charts, email, and text messaging. The Gantt chart (figure 1), a commonly used project management tool,5 is a horizontal bar chart6 used to illustrate tasks completed over a period of time in relation to the amount of time allotted for the task; it includes the start and end dates of tasks, shows which team members are assigned to each task,6 and it can serve as a central communication tool. Gantt charts allow users to visualize the project in smaller, more manageable sections and monitor progress throughout the project’s lifecycle.6 Gantt charts are mainly created with digital applications and can be displayed and shared electronically (e.g., through shared drives) or in various printed formats. However, a Gantt chart differs from email and text messaging as it does not allow for interactive communication; it communicates information visually. Interactive communication is a two-way process of exchanging communication between senders and recipients.7
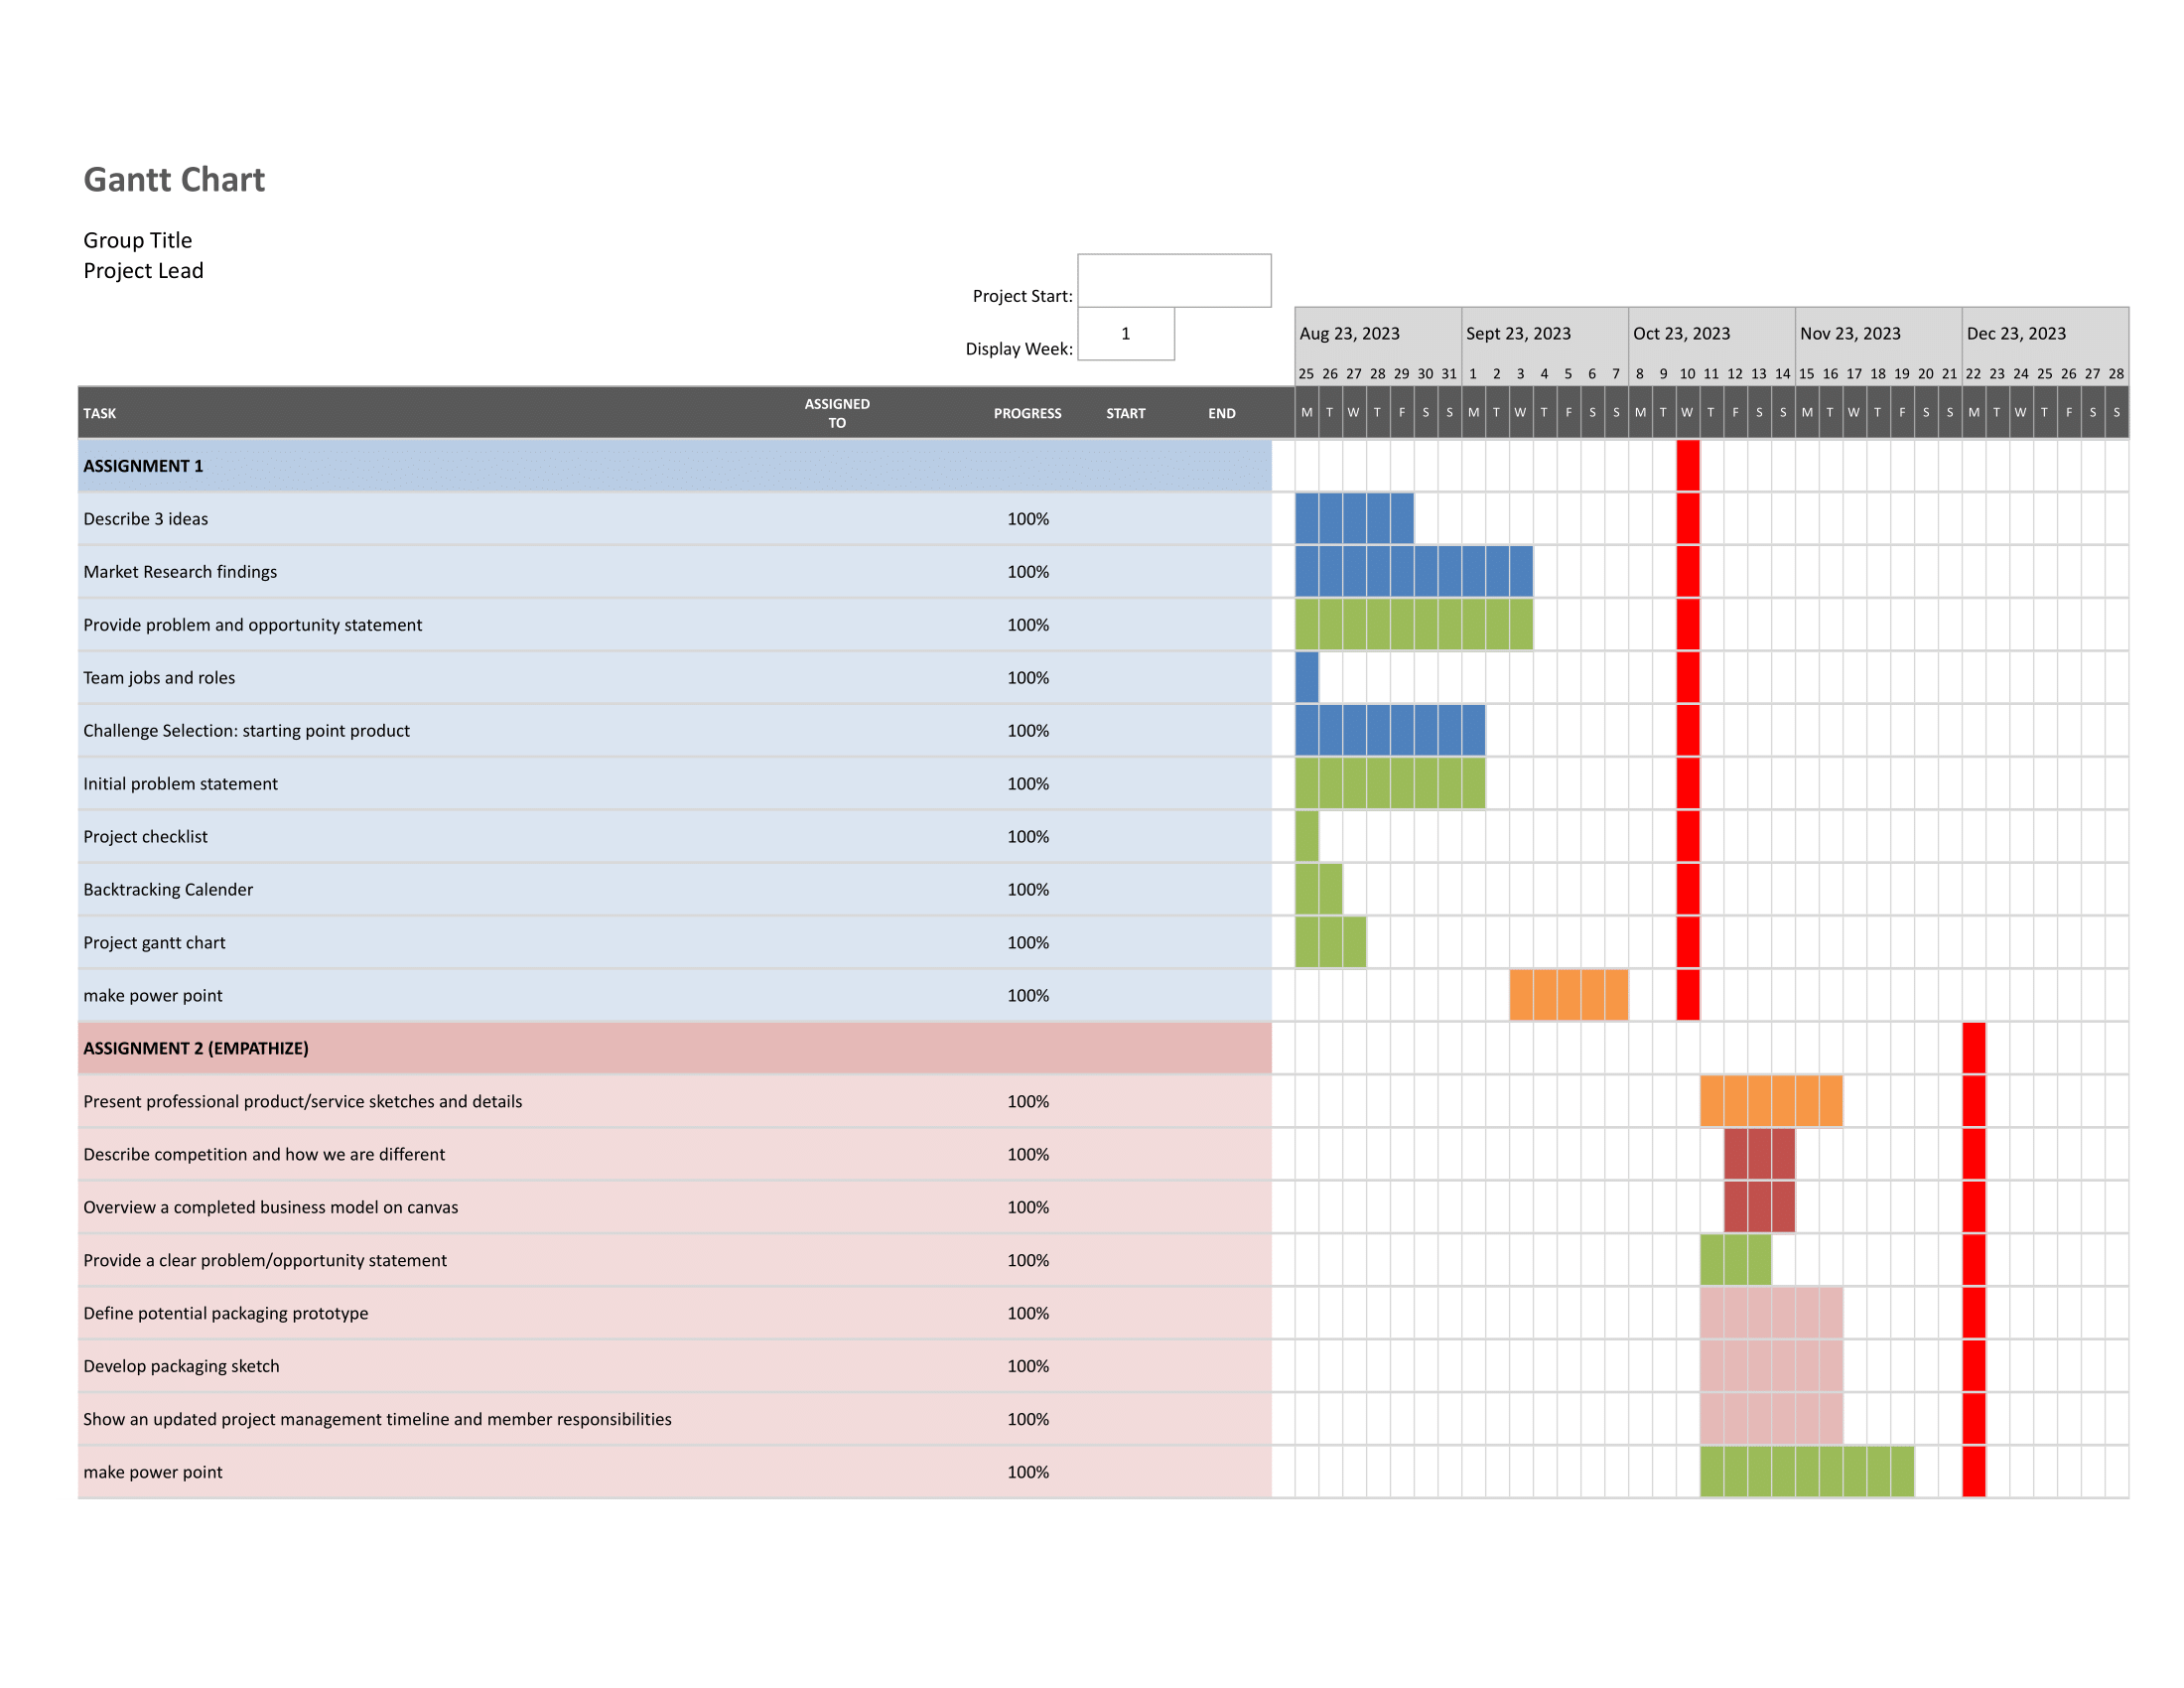
Figure 1. Example of a Gantt chart. Image credit: screenshot by author.
Emails and text messaging are interactive digital forms of communication and can be alternatives to a Gantt chart in a classroom setting. Email addresses are required for emailing, and cell phone numbers are needed for text messaging. Email has progressed from being purely communicative to encompassing task management and scheduling responsibilities.8 Emails can be accessed from devices with internet connection, including computers, tablets, and cell phones. Still, email communication may be more effective than utilizing multiple communication forms (e.g., a Gantt chart and email). Text messaging is accessible on cell phones and electronic devices with an internet connection and texting application. Email and text messaging are the most frequently used forms of nonpersonal communication for US adults.9 Ninety-two percent of US adults carry text-enabled phones and have text messaging open rates at 98%10 and response rates of 45%.11 In contrast, email open and response rates are 20% and 6%, respectively.11 Based on a Gallup Poll, the age group with the highest amount of text messages sent and received was 18–29, at 68%.9 Despite the popularity of text messaging for this age bracket, the question remains as to whether it is the most effective method for disseminating group project information since response rates are below 50%.
Description of Teaching Activity
At the beginning of the semester, the PKSC 8200: Advanced Package Design class was divided into six teams of five to six students, with at least one graduate student assigned to each team as the team leader. Each team worked on a semester-long project entailing the development of a packaged product from the initial idea to the final prototype. The class met twice weekly, with class and lab time on Wednesdays. During class time on Wednesdays, the professor would typically teach a lesson regarding the next assignment, and lab time was to be used by teams to work towards the completion of necessary tasks. As this was a time designated for group work, it was intended to be when most of the collaboration occurred for research, product prototyping, and presentation design. At least six times throughout the semester, each team would be required to give a presentation about the progress of their project according to guidelines and criteria established by the instructor. The presentations focused on primary milestones of the projects, including market research, brainstorming, ideation, prototype building and testing, vendor identification, budget development, life cycle analysis, thirty-second commercial creation, and the construction of a final, professional-quality prototype. Verbal feedback from the instructor, faculty teaching assistant, and classmates was provided immediately after each presentation, with written feedback provided by the instructor as the grades were posted.
One of the first assignments required creating a Gantt chart to visualize all tasks to be completed throughout the semester and assign team members to these tasks. In collaboration with the team, the team leader created the Gantt chart document, inputted the tasks listed on the syllabus, and attempted to distribute roles evenly among team members. The first two presentations required sharing the Gantt chart and then updating the chart. The instructor expected the students to continually check the Gantt chart and take responsibility for their designated roles on the project.
Figure 2 shows an example of how a Gantt chart could be used to illustrate the required elements for assignments. Students can see that the topic of market research needs to be addressed in assignments 1–3, but after that, they can concentrate on the other topics. Prototyping should be addressed beginning in assignment 3 and included in all assignments afterward. Likewise, the remaining topics are introduced later but should be included in each assignment afterward.
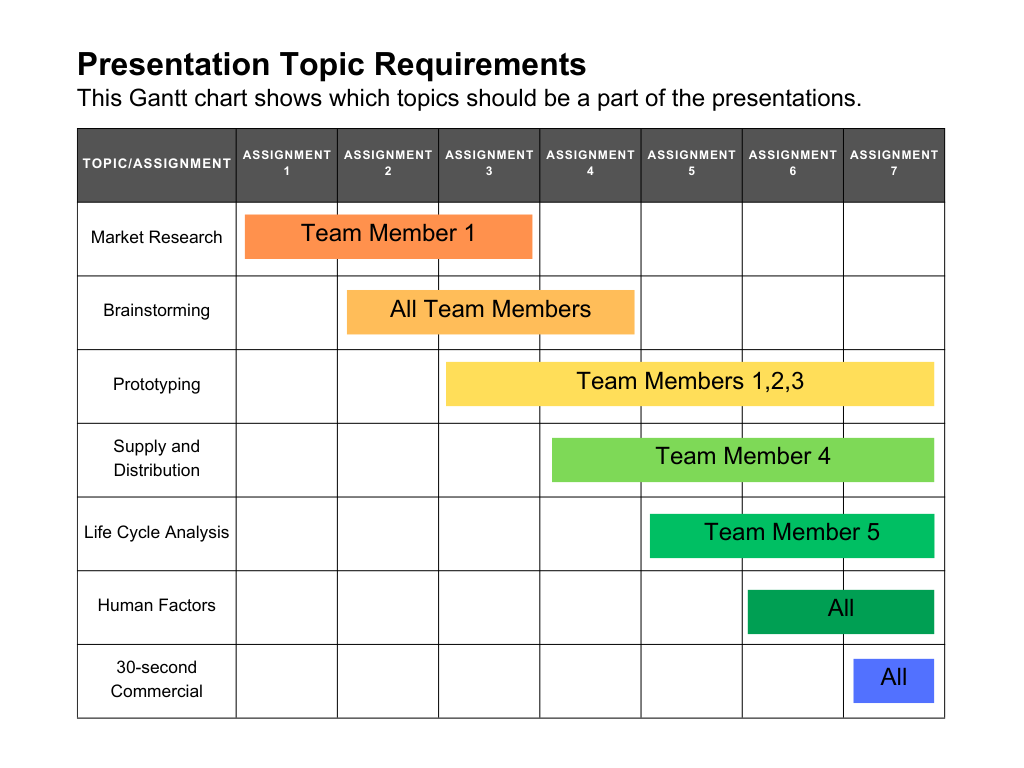
Figure 2. Sample Gantt chart showing when particular topics need to be covered in required assignments. Image credit: Toni Sharp, Clemson University.
A group text messaging list was created during the first class of the semester to enable quick and efficient communication among the team members. This method was initially to be used for group reminders regarding due dates. The text messages were to be sent at the beginning or end of each week to reiterate previously discussed responsibilities for each assignment. Additionally, a group email that listed the initial responsibilities of the team members for the first assignment was distributed. Emails were intended to serve as the primary form of information dissemination, with text messaging as a support method. The expectation of the team leader was that team members would respond to the text messages either with a written reply or acknowledgment of the message.
Near the end of the semester, the instructor met with all the team leaders to discuss their leadership experiences. Each team leader submitted a management report and a written reflection about one aspect of project group management they had encountered. This publication is based on the reflections of one of the graduate student team leaders and the co-author of this publication.
Discussion of Outcomes
Deliberate quantitative data was not collected; however, there is a record of how many emails and text messages were sent and responded to between the team leader and team members. Based on the response rates shown in table 1, the team leader concluded that email was not an effective method of communicating with the group. The main issue with email communication was that there was no method of monitoring who had read a message unless a response was received. When attempts to delegate roles were made via email, there was no response from team members. Team members would then come to class unsure of their responsibilities for that week. Therefore, the team leader had to delegate roles in person during the next class period.
Since emails were not an efficient means of communication, the team leader turned to text messaging. As shown in table 1, the team leader sent seventy-seven messages to their team. Of the messages that asked a direct question with an expectation for response, an average of two to three undergraduate team members responded each time; of the three team members who responded with some degree of regularity, on average, one to two members responded with a typed response while the other team member responded with a thumbs up symbol. More than half of the time, one team member did not respond at all.
Table 1. Communication frequency during the semester: summary of messages sent and responses received.
| Method of Communication | Frequency | Response Rate | Response Received |
| Emails | 29 sent | 12 required a response
• 11 emails sent, no response |
Typed response |
| Text messages | 77 sent | • 2 to 3 responses to each text | • 1 to 2 typed responses • 1 thumbs-up symbol |
When the team leader asked team members about their communication preferences, the Gantt chart was the least preferred, and text messaging was the most preferred. This aligned with the team leader’s belief that text messaging would be this team’s most effective communication method for this group, given the better response rate.
Many meetings were held virtually, and when asked about emails that had been sent to them, the team members were often unaware of the emails and/or documents being referenced. No follow-up questions were asked of the team members, so it is unknown whether this resulted from the emails not being received by the team members, the team members not seeing the emails, or some other issue.
The use of text messaging primarily aligned with published research, as people typically use text messaging more than email.11 Text messaging yielded the most responses and decreased the amount of in-person delegation necessary to an extent. However, certain team members still required further explanations or reminders of their roles when they met again. As the semester progressed, it became easier for the team leader to simply utilize the course syllabus to plan and schedule tasks approximately two weeks in advance to identify the work required. Doing so was more efficient than adjusting tasks, roles, and deadlines on the Gantt chart. The initial goal for the Gantt chart was for the team members to continually reference the Gantt chart and take responsibility for their designated project roles to meet deadlines; however, the team members relied on the team leader to designate roles and send reminders via weekly text messaging. Instead of using the Gantt chart to provide self-efficacy, the team members quickly fell into a pattern of depending upon the team leader for information and assignments. While this kept the team leader on a regular schedule and up to date on project goals, some team members were unaware of the project status until the team leader confirmed their responsibilities for a specific assignment.
Reflection of Outcomes
Knowing the value of a Gantt chart in the professional world, the instructor wanted to provide students with an opportunity to use one. A semester-long project requiring short-range and long-term planning among a team of five to six students seemed ideal. After conferring with the team leaders, the instructor realized that teams were not collaborating around the Gantt chart but were instead waiting for the team leader to delegate roles during class, and teams would then update the chart after completing assignments.
In the professional world, there are employees and contractors. Employees are hired into a company and are subject to the employer’s policies. Employees may be required to use the company’s programs, tools, or equipment as a condition of employment. A contractor may be self-employed and provide services to companies as a non-employee. Although contractors may be offered access to company programs, tools, and equipment, they may choose not to utilize them.
University students are similar to contractors in that they can be introduced to programs, tools, or equipment, but if they are not required to use them, they may choose other more familiar options. As noted in the outcomes above, a Gantt chart was less familiar to the students. While powerful in visualizing a project schedule and the overlapping of tasks, Gantt charts do not provide interactive digital communications to encourage task completion. Additionally, students tend to work on things in sequential order: finish step one, move on to step two, give a presentation, move to step three, etc. Whereas Gantt charts focus more on parallel work—aligning independent members responsible for discrete project tasks—project team members are responsible for the entirety of the project and work at the same frequency.
In an era of instant gratification, interactive digital communication is an effective form of communication. Email and text messaging allow for instantaneous conversations with multiple people. There is a chance of delayed responses to email and text messages, but using text messaging in the above scenario was found to be the most effective form of communication among the three options.
Discussion of Potential Adoption in Other Courses
A Gantt chart is a beneficial tool for project management and is used extensively in the professional world. However, as reported in the above outcomes, students seemed reluctant to utilize it. Still, there are ways to help students understand the benefits of using a Gantt chart in tandem with text messaging to provide interactive communication among team members.
Since students tend to work sequentially, a Gantt chart might not be favorable for every group project, but it is a beneficial resource for students to become acquainted with. An instructor who would like students to understand how to use Gantt charts needs to devote time to explaining them, providing examples of how to use them, detailing when they are an appropriate resource, and discussing what additional forms of communication could complement their use.
References Cited
- Buck Institute for Education. What is PBL? PBLWorks. [accessed 2022 Dec 1].
https://www.pblworks.org/what-is-pbl. - Shin M-H. Effects of project-based learning on students’ motivation and self-efficacy. English Teaching. 2018;73(1):95–114. doi:10.15858/engtea.73.1.201803.95.
- Pereira J, Díaz Ó. Struggling to keep tabs on Capstone Projects: A Chatbot to tackle student procrastination. ACM Transactions on Computing Education. 2022;22(1):1–22. doi:10.1145/3469127.
- Young Illies M, Stachowski AA. Improving students’ teamwork experience: Evaluating a project management application. Scholarship of Teaching and Learning in Psychology. 2020;6(1):46–52. doi:10.1037/stl0000155.
- Geraldi J, Lechter T. Gantt charts revisited. International Journal of Managing Projects in Business. 2012;5(4):578–594. doi:10.1108/17538371211268889.
- Kumar PP. Effective use of Gantt chart for managing large-scale projects. Cost engineering. 2005 Jul 1;47(7):14. https://www.proquest.com/docview/220442584?pq-origsite=gscholar&fromopenview=true.
- Drew C. Interactive model of communication: examples and definition. Helpful Professor. 2023 Aug 20 [accessed 2023 Nov 16]. https://helpfulprofessor.com/interactive-model-of-communication/.
- Ducheneaut N, Bellotti V. E-mail as habitat. Interactions. 2001;8(5):30–38. doi:10.1145/382899.383305.
- Newport F. The new era of communication among Americans. Gallup.com. 2021 Mar 23 [accessed 2022 Dec 1]. https://news.gallup.com/poll/179288/new-era-communication-americans.aspx.
- 44 mind-blowing SMS marketing and texting statistics [updated]. SlickText. 2022 Oct 5 [accessed 2022 Dec 1]. https://www.slicktext.com/blog/2018/11/44-mind-blowing-sms-marketing-and-texting-statistics/.
- Cote S. The future of sales follow-ups: Text messages. Gartner. 2019 Oct 4 [accessed 2022 Dec 1]. https://www.gartner.com/en/digital-markets/insights/the-future-of-sales-follow-ups-text-messages.