

Maintaining water quality in surface waters, particularly for ponds and irrigation reservoirs, is essential for safe water use but can be challenging to accomplish. Mitigating and reducing nutrient levels is critical for managing risks of harmful algal blooms for agricultural operations, municipal drinking water suppliers, and other water resource professionals. This article presents cost information about three best management practices (BMPs) treatment technologies well-suited to improving water quality for agricultural operations and small pond owners.
Introduction
Several best management practices (BMPs) are available on the market for improving water quality. However, choosing the most effective and cost-efficient option can be challenging for decision makers—such as farmers, water suppliers, and community managers or homeowners—without knowing how different technologies compare in terms of relative costs.
This article presents cost comparisons for three selected water quality treatment technologies: aerators, floating treatment wetlands (FTWs), and bioreactors (e.g., woodchip biofilters) (Figure 1).
- Aerator: A pump that moves air from a land surface through a hose to an underwater aeration diffuser that releases air-bubbles to add oxygen to the water column and keep water moving.1 (Technical assumption in this article: A 20 kW aerator operates for 5 hours per day at a rate of 14.2 cents per kWh.)
- FTW: A floating platform that holds plant crowns above water and allows the root systems to extend into the water column to filter nutrients, metals, sediments, and more from water.2,3 FTW platforms can be intensive (thicker, can be walked on) or extensive (thinner, cannot be walked on), which influences the associated costs.4 (Technical assumption in this article: A platform made of 17,637 lb of cereal straw with Southern Cattail seedlings (Typha domingensis), with total filter dimensions ranging from 328 to 354 feet in length and 19 feet in width).
- Bioreactor: A structure filled with biofilter (e.g., woodchips) designed to allow water to flow through it quickly. The woodchips serve as a carbon source that supports microbe growth and reduces nitrates.5 (Technical assumption in this article: The bioreactor consists of biochar-amended woodchip filters with a length of 24 feet and a width of 18 feet).
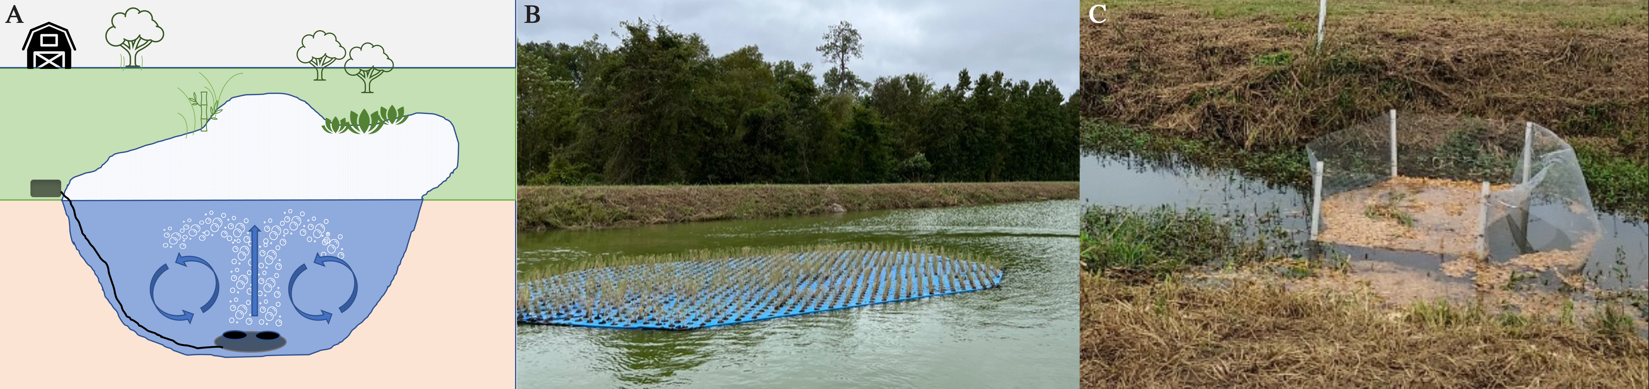
Figure 1. (A) aerator graphic, (B) floating treatment wetland deployed in an irrigation reservoir, and (c) in-channel flow-through woodchip bioreactor upstream from an irrigation reservoir (Photo credit: Clemson Extension a. Becky Davis, b. Sarah A White, c. Dawoon Jeong).
Economic Considerations
Each of these treatments can be implemented by agricultural and other water users to address nutrient-related water quality issues in irrigation and recreational ponds. When selecting among these technologies, it is helpful to compare the economic costs, as each option involves different equipment and operational requirements. Additionally, a comprehensive cost analysis should consider both the fixed lifetime use of the technologies and the per-unit nitrogen removal rates. Thus, we examine the present values of costs per unit nitrogen removal provided by each technology. This section outlines the types of costs and the economic assumptions used to model them, followed by our main findings on the estimated costs for the three technologies.
Types of costs and assumptions
Capital costs include initial investment, consisting of acquisition of equipment and materials, installation, and related expenses for implementation of the technology. Land acquisition, labor for construction, and replacement or decommission-related costs are not considered in this article to be consistent across the three treatment technologies.
Operating costs include operation and maintenance (O&M) expenses. These costs recur throughout the project years, unlike capital costs, which occur only once at the beginning of the project. Therefore, the streams of operating costs are expressed in present value terms (2025 USD), accounting for an annual 3% discount on costs9. Operating costs vary by treatment technology type. Aerators require electricity for regular operation, unlike other treatment technologies. FTWs may require weeding or plant removal. Also, preventing excess plant material on FTWs may involve extra costs. However, the extra plants harvested from FTWs could serve as a revenue source if sold for other purposes (e.g., restoration plantings, ornamental gardens).10
Table 1 summarizes the economic assumptions used in this article.
Table 1. Summary of economic modeling assumptions.
| Assumption | Aerators | FTWs | Bioreactors |
| Discount rate | 3 % | 3% | 3% |
| Operating years | 20 years7 | 10 years8 | 15 years6 |
| Value presented year | 2025 | 2025 | 2025 |
| Note: Operating years are based on assumptions from previous literature (as indicated in the superscripts); actual lifespans may vary depending on the specific design. | |||
Cost comparisons
Table 2 summarizes the capital and operating costs of three technologies. Operating costs are calculated by considering the number of operating years and the discount rates listed in Table 1, to show the present value of costs in 2025 consistently across all three systems. All values are expressed in 2025 USD, consistent with the assumptions presented in Table 1.
Table 2. Capital cost breakdowns of select water treatment technologies.
| Unit (2025 USD) | Aerators | FTWs | Bioreactors |
| Capital costs | 1,082 | 30,092 | 7,851 |
|
1,082 | 3,420 | 2,947 |
|
– | 8.247 | 4,904 |
|
– | 18,452 | |
| Operating annual costs | 3,785 | 1,625 | – |
|
– | 462 | – |
|
3,785 | 1,163 | – |
| Note: Capital costs for the aerator were sourced from the purchase receipt provided by Sarah White. Capital costs for the FTWs were derived from the study reported in reference8, while capital costs for the bioreactor were obtained from reference6. For annual operating costs, “others” refers to electricity expenses for aerators, and for FTWs, it includes technical maintenance (e.g., water analysis) and aerial biomass extraction activities such as silage machinery use and plastic for silage. | |||
We present our main cost comparisons by accounting for technical efficiency. This is because when comparing systems, it is also important to account for their efficiency, since the primary purpose of these technologies is to remove nutrients such as nitrogen. The total capital costs presented in Table 2 alone are not sufficient to evaluate the technical performance of the three systems—specifically, how effectively they remove nitrogen. To incorporate efficiency into the cost perspective, we present below the costs per unit of nitrogen removed—that is, the dollars required to remove one pound of nitrogen.
Figure 2 illustrates a cost comparison of the three water treatment technologies in 2025 USD, categorized into capital and operating expenses based on the published costs- based on author-calibrated cost estimates- of aeration6, FTWs7, and woodchip biofilters8. Table 3 provides the corresponding data used to generate figure 2. It is important to note that exact costs may vary based on site-specific requirements and design choices. However, the structure of associated expenses could remain consistent across different locations, allowing for a cost comparison between these technologies.
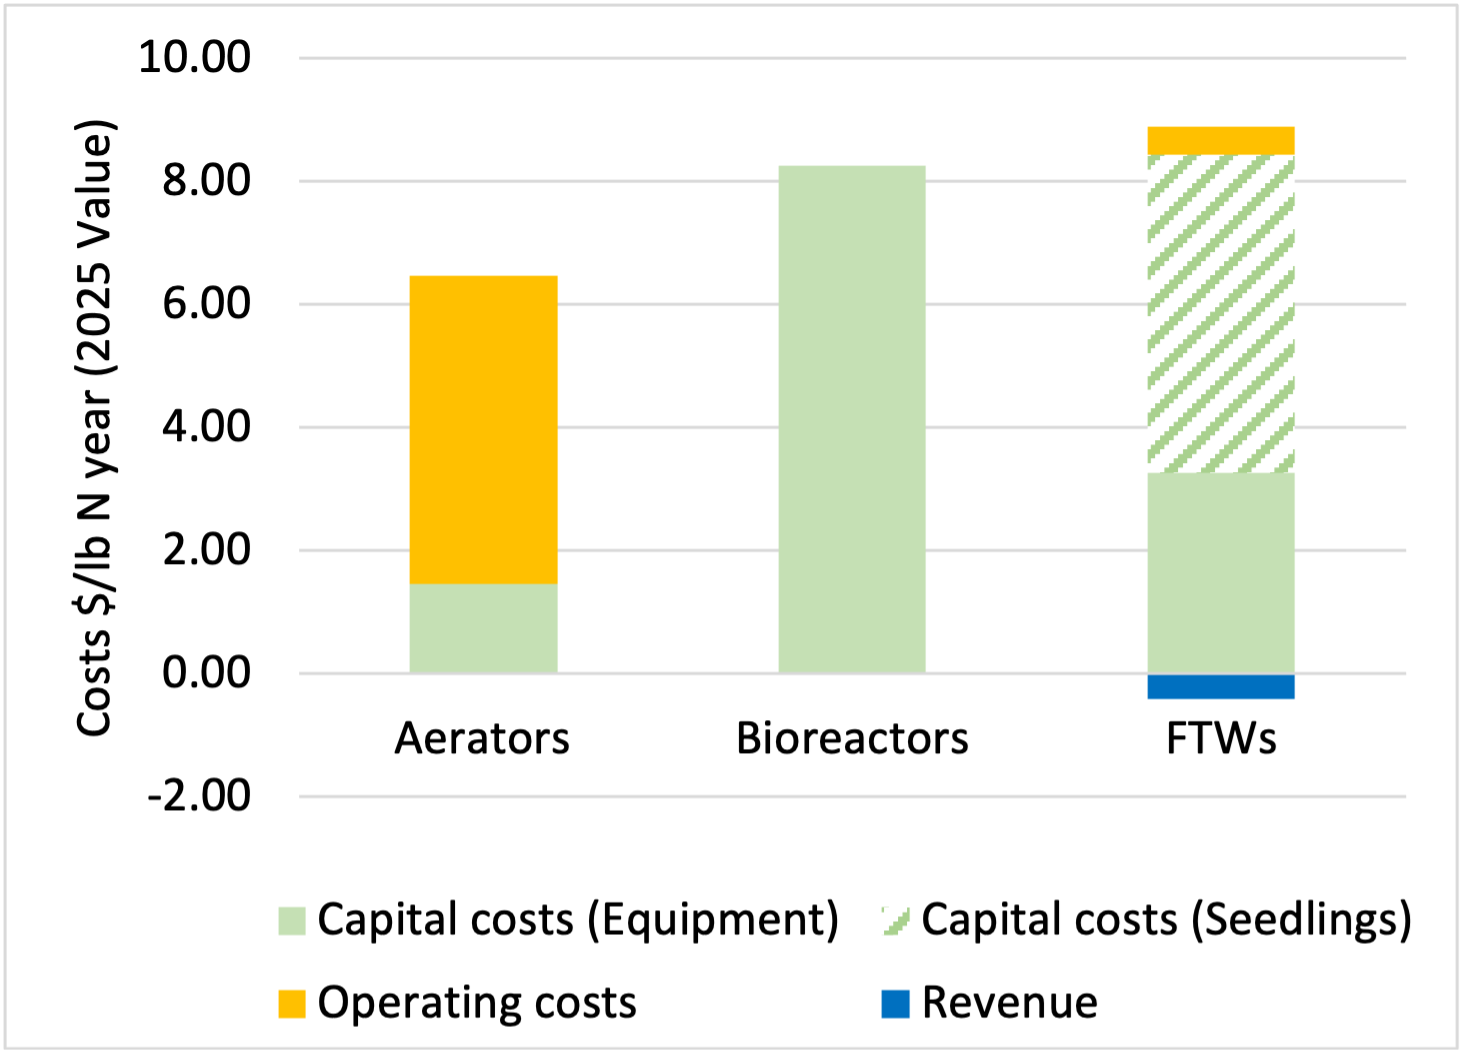
Figure 2. Total cost breakdowns of the selected water quality treatment technologies per unit of nitrogen removed per year, accounting for system efficiency.6-8
Table 3. Total cost breakdowns of select water quality treatment technologies per unit nitrogen reduction per year.6-8
| Unit: ($/N lb year) | |||||||
| Capital costs | Operating costs | Total Costs | |||||
| Equipment | Seedlings | Operation and Maintenance | Potential Revenue | ||||
| Aerators | 1.47 | – | 5.01 | – | 6.47 | ||
| Bioreactors | 8.25 | – | – | – | 8.25 | ||
| FTWs | 3.27 | 5.16 | 0.46 | (0.42) | 8.47 | ||
Based on Figure 2 and Table 3, among the three treatment technologies, aerators have the lowest total costs per unit nitrogen reduction per year, while FTWs and bioreactors have similar overall costs; but their types of costs differ significantly. Understanding the types of costs is important for evaluating which investment is best.
Key differences in costs include:
- FTWs and bioreactors have relatively higher overall costs due to their capital costs.
- FTWs may require purchasing seedlings, which represents the most significant capital cost.
- Aerators incur higher operating costs due to daily electricity consumption.
- FTWs are unique in their potential to generate revenue through the sale of harvested plants.
Other Factors That Could Affect Economic Costs
It is also important to acknowledge that economic costs are likely sensitive to climate impacts. Although the variability of costs under different climate scenarios is beyond the scope of our current analysis, this sensitivity should be explored in future research. In addition, scalability beyond small farms (e.g., municipal or large-scale stormwater applications) is relevant to economic costs, as larger scales typically reduce overall costs due to economies of scale. This presents another promising direction for future studies. Lastly, the role of regulatory incentives is also worth considering in future sensitivity analyses. Potential policies—such as electricity subsidies or carbon credit markets—could influence the relative economic benefits by reducing costs across the three systems presented here.
Conclusion
Three water treatment technologies are commercially available to enhance on-farm surface water quality: aerators, FTWs, and bioreactors. While the total costs of these technologies are relatively similar, there are differences between capital and operating expenses.
Based on published cost information, aeration appears more cost-effective than the other selected technologies. The relative cost-effectiveness is site-specific and cost sensitivity can vary under different scenarios. If actively managed via harvesting and replanting, FTWs will have the highest capital costs compared with the other technologies; though the style of FTW used (intensive vs. extensive) also influences capital expenditure costs. Other factors, such as the relative costs of supply materials (e.g., woodchips) and electricity prices, also impact the overall cost comparison.
When selecting a water treatment technology, it is important to consider site-specific conditions and cost-effectiveness for achieving desired water quality goals.
Acknowledgement
This material is based upon work that is supported by the National Institute of Food and Agriculture, U.S. Department of Agriculture through the Southern Sustainable Agriculture Research and Education program under subaward number LS21-2595 and by the Research Capacity Fund (Hatch), project award no. SC-1700676. USDA is an equal opportunity employer and service provider.
References Cited
1. Burns, F. L. (1994). Case study: Blue-green algal control in Australia by year-round automatic aeration. Lake and Reservoir Management, 10(1), 61–67. https://doi.org/10.1080/07438149409354175
2. White, S. A., & Cousins, M. M. (2013). Floating treatment wetland aided remediation of nitrogen and phosphorus from simulated stormwater runoff. Ecological Engineering, 61, 207–215. https://doi.org/10.1016/j.ecoleng.2013.09.020
3. Escamilla, C., Scaroni, A. E., & White, S. A. (2024, January 24). An introduction to floating wetlands for stormwater ponds (LGP 1185). Clemson Cooperative Extension, Land-Grant Press by Clemson Extension. https://lgpress.clemson.edu/publication/an-introduction-to-floating-wetlands-for-stormwater-ponds/
4. Strosnider, W. H., Schultz, S. E., Strosnider, K. A. J., & Nairn, R. W. (2017). Effects on the underlying water column by extensive floating treatment wetlands. Journal of Environmental Quality, 46(1), 201–209. https://doi.org/10.2134/jeq2016.07.0257
5. Christianson, L. E., Bhandari, A., & Helmers, M. J. (2012). A practice-oriented review of woodchip bioreactors for subsurface agricultural drainage. Applied Engineering in Agriculture, 28(6), 861–874. https://doi.org/10.13031/2013.42479
6. DeBoe, G., Bock, E., Stephenson, K., & Easton, Z. (2017). Nutrient biofilters in the Virginia Coastal Plain: Nitrogen removal, cost, and potential adoption pathways. Journal of Soil and Water Conservation, 72(2), 139–149. https://doi.org/10.2489/jswc.72.2.139
7. Resende, J. D., Nolasco, M. A., & Pacca, S. A. (2019). Life cycle assessment and costing of wastewater treatment systems coupled to constructed wetlands. Resources, Conservation and Recycling, 148, 170–177. https://doi.org/10.1016/j.resconrec.2019.04.034
8. San Miguel, G., Martín-Girela, I., Ruiz, D., Rocha, G., Curt, M. D., Aguado, P. L., & Fernández, J. (2023). Environmental and economic assessment of a floating constructed wetland to rehabilitate eutrophicated waterways. Science of the Total Environment, 884, 163817. https://doi.org/10.1016/j.scitotenv.2023.163817
9. U.S. Environmental Protection Agency. (2024). Guidelines for preparing economic analyses (3rd ed.; EPA-240-R-24-001). https://www.epa.gov/environmental-economics/guidelines-preparing-economic-analyses-3rd-edition
10. Garcia Chance, L. M., Hall, C. R., & White, S. A. (2022). Viability assessment for the use of floating treatment wetlands as alternative production and remediation systems for nursery and greenhouse operations. Journal of Environmental Management, 305, 114398. https://doi.org/10.1016/j.jenvman.2021.114398